• Chinese Optics Letters
  • Vol. 18, Issue 4, 040601 (2020)
Huiyuan Liu, He Wen, and Guifang Li*
Author Affiliations
  • CREOL, The College of Optics & Photonics, University of Central Florida, Orlando, FL 32816, USA
  • show less
    DOI: 10.3788/COL202018.040601 Cite this Article Set citation alerts
    Huiyuan Liu, He Wen, Guifang Li. Applications of weakly-coupled few-mode fibers [Invited][J]. Chinese Optics Letters, 2020, 18(4): 040601 Copy Citation Text show less
    Effective index difference between the first two modes, as a function of the effective area of the fundamental mode, with varying core radius for each core index, in (a) two-mode step-index fiber and (b) two-mode graded-index fiber. Step-index fiber with a 1.45 core index and a large range of core radius is plotted as the reference curve.
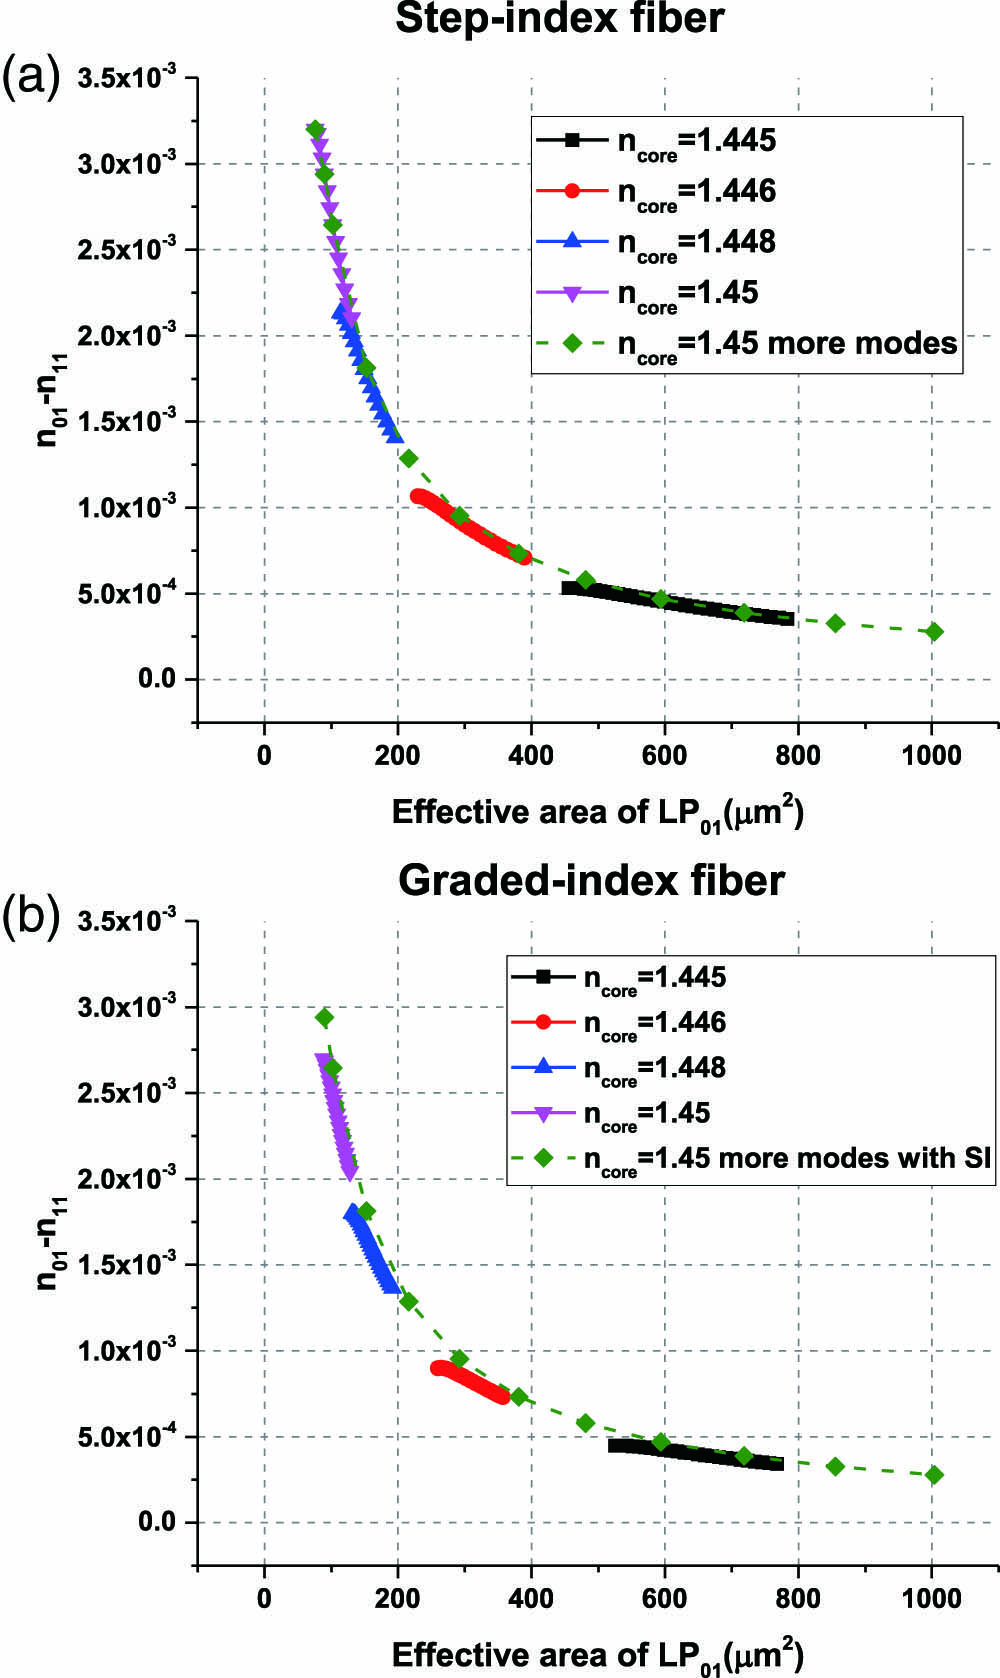
    Fig. 1. Effective index difference between the first two modes, as a function of the effective area of the fundamental mode, with varying core radius for each core index, in (a) two-mode step-index fiber and (b) two-mode graded-index fiber. Step-index fiber with a 1.45 core index and a large range of core radius is plotted as the reference curve.
    (a) Effective index difference vs. effective area curve fitting for graded-index fiber. (b) The multiplication constant as a function of wavelength for SI or GRIN fibers with two or ten modes.
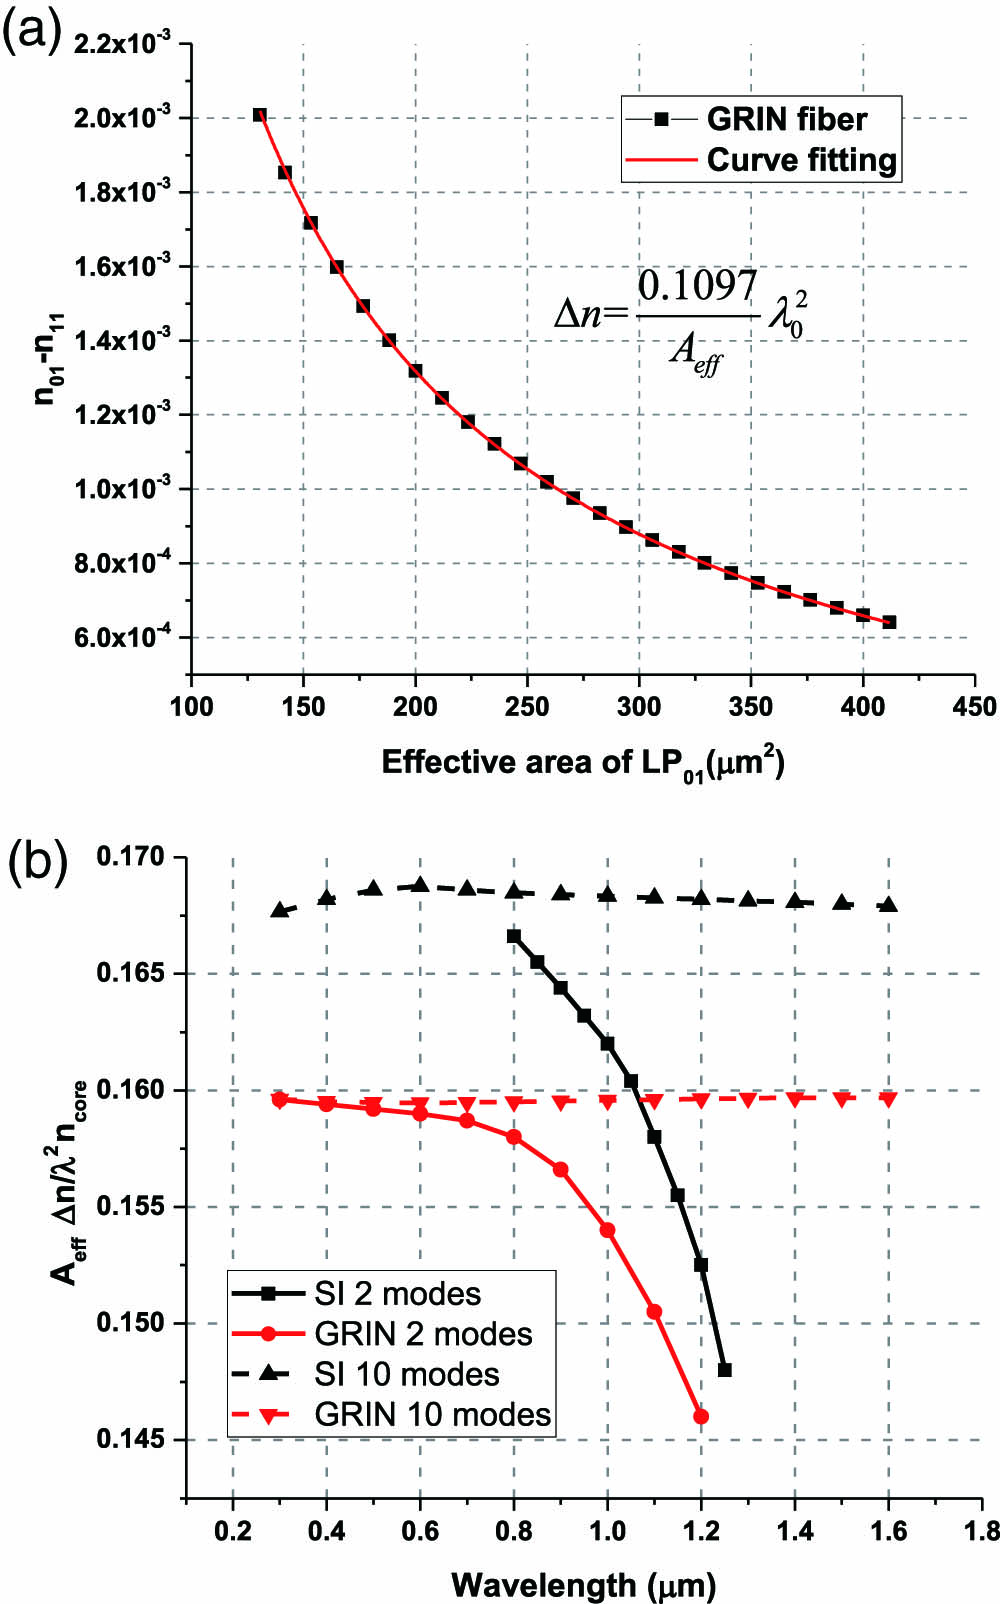
    Fig. 2. (a) Effective index difference vs. effective area curve fitting for graded-index fiber. (b) The multiplication constant as a function of wavelength for SI or GRIN fibers with two or ten modes.
    (a) Index profiles for two-step SI fibers (high or low index for the inner step), a GRIN fiber with a trench, a triangular-index fiber, and a fiber corresponding to the reversed LP11 mode profile. (b) Corresponding curves of effective index difference vs. effective area.
    Fig. 3. (a) Index profiles for two-step SI fibers (high or low index for the inner step), a GRIN fiber with a trench, a triangular-index fiber, and a fiber corresponding to the reversed LP11 mode profile. (b) Corresponding curves of effective index difference vs. effective area.
    Fundamental mode profiles of (a) three-core fiber and (b) six-core fiber. (c) Corresponding curves of effective index difference vs. effective area.
    Fig. 4. Fundamental mode profiles of (a) three-core fiber and (b) six-core fiber. (c) Corresponding curves of effective index difference vs. effective area.
    (a) Effective index difference of the 1st and 4th supermodes, and (b) the effective index difference of the first two supermodes vs. the effective area of 1st supermode, for different core distances.
    Fig. 5. (a) Effective index difference of the 1st and 4th supermodes, and (b) the effective index difference of the first two supermodes vs. the effective area of 1st supermode, for different core distances.
    Setup for the 10×10 Gbaud/s PDM QPSK WDM transmission experiment through the fundamental mode of FMFs. (a), (b), and (c) are the transmitter, fiber loop, and coherent detection parts. DFB: distributed feedback laser, PMC: polarization maintaining coupler, PBC: polarization beam combiner, VOA: variable optical attenuator, IL: interleaver, SW: optical switch, FMF: few-mode fiber, WSS: wavelength selective switch, PM-EDFA: polarization-maintaining erbium-doped fiber amplifier, LO: local oscillator, PD: photodiode. Reprinted from Ref. [35].
    Fig. 6. Setup for the 10×10Gbaud/s PDM QPSK WDM transmission experiment through the fundamental mode of FMFs. (a), (b), and (c) are the transmitter, fiber loop, and coherent detection parts. DFB: distributed feedback laser, PMC: polarization maintaining coupler, PBC: polarization beam combiner, VOA: variable optical attenuator, IL: interleaver, SW: optical switch, FMF: few-mode fiber, WSS: wavelength selective switch, PM-EDFA: polarization-maintaining erbium-doped fiber amplifier, LO: local oscillator, PD: photodiode. Reprinted from Ref. [35].
    Q-factor for the center channel as a function of the launched power per channel after 3100 km for FMFs, and after 3040 km for SMFs. The constellation diagrams for X polarization at the optimal power for both cases are shown in the insets. Reprinted from Ref. [35].
    Fig. 7. Q-factor for the center channel as a function of the launched power per channel after 3100 km for FMFs, and after 3040 km for SMFs. The constellation diagrams for X polarization at the optimal power for both cases are shown in the insets. Reprinted from Ref. [35].
    (a) Refractive index profile of FMF, and effective indices of LP modes. Measured impulse response for (b) PL 1, (c) PL 2, and (d) PL 3. Each PL is spliced to a 20 km FMF. Reprinted from Ref. [19].
    Fig. 8. (a) Refractive index profile of FMF, and effective indices of LP modes. Measured impulse response for (b) PL 1, (c) PL 2, and (d) PL 3. Each PL is spliced to a 20 km FMF. Reprinted from Ref. [19].
    Experiment setup for MGM transmission. BERT: bit error ratio tester; EDFA: erbium-doped fiber amplifier; VOA: variable optical attenuator; PC: polarization controller; PL: photonic lantern; PD: photodetector. Reprinted from Ref. [19].
    Fig. 9. Experiment setup for MGM transmission. BERT: bit error ratio tester; EDFA: erbium-doped fiber amplifier; VOA: variable optical attenuator; PC: polarization controller; PL: photonic lantern; PD: photodetector. Reprinted from Ref. [19].
    (a) Measured BERs as functions of transmitted power for detecting only one of the degenerate modes or both degenerate modes of the LP11 and LP21 group. (b) The measured BERs as functions of received power for detecting only one of degenerate modes or both degenerate modes of the LP21 group for two different transmitting polarizations (P1 and P2). (c) The measured BERs as functions of transmitted power for three mode groups. The hollow symbols represent separate mode-group transmissions, and solid symbols represent MGM transmissions. Reprinted from Ref. [19].
    Fig. 10. (a) Measured BERs as functions of transmitted power for detecting only one of the degenerate modes or both degenerate modes of the LP11 and LP21 group. (b) The measured BERs as functions of received power for detecting only one of degenerate modes or both degenerate modes of the LP21 group for two different transmitting polarizations (P1 and P2). (c) The measured BERs as functions of transmitted power for three mode groups. The hollow symbols represent separate mode-group transmissions, and solid symbols represent MGM transmissions. Reprinted from Ref. [19].
    PON architectures using (a) an SMF with a power splitter and (b) an FMF with a mode multiplexer.
    Fig. 11. PON architectures using (a) an SMF with a power splitter and (b) an FMF with a mode multiplexer.
    Measured BERs of the six-mode optical link at 1 Gb/s. Reprinted from Ref. [21].
    Fig. 12. Measured BERs of the six-mode optical link at 1 Gb/s. Reprinted from Ref. [21].
    Schematic of the six-mode-GPON system using a PL spliced to 20 km FMF for upstream transmission with commercial OLT and ONUs. OLT: optical line terminal; ONU: optical networking unit; PL: photonic lantern. Red line: 1490 nm transport; blue line: 1310 nm transport; gray line: bidirectional transmission. Reprinted from Ref. [21].
    Fig. 13. Schematic of the six-mode-GPON system using a PL spliced to 20 km FMF for upstream transmission with commercial OLT and ONUs. OLT: optical line terminal; ONU: optical networking unit; PL: photonic lantern. Red line: 1490 nm transport; blue line: 1310 nm transport; gray line: bidirectional transmission. Reprinted from Ref. [21].
    Measured packet loss of 9 ONUs in the six-mode PON in 12 h. Reprinted from Ref. [21].
    Fig. 14. Measured packet loss of 9 ONUs in the six-mode PON in 12 h. Reprinted from Ref. [21].
    Experimental setup for WDM transmission over an FMF link. The inset illustrates the generation of nonlinear cross talk due to four-wave mixing. Reprinted from Ref. [20].
    Fig. 15. Experimental setup for WDM transmission over an FMF link. The inset illustrates the generation of nonlinear cross talk due to four-wave mixing. Reprinted from Ref. [20].
    Experimental results for WDM transmission over an FMF link. (a) Measured microwave power of the nonlinear cross talk caused by the FWM effect. (b) The estimated SFDRs as functions of received optical power. Reprinted from Ref. [20].
    Fig. 16. Experimental results for WDM transmission over an FMF link. (a) Measured microwave power of the nonlinear cross talk caused by the FWM effect. (b) The estimated SFDRs as functions of received optical power. Reprinted from Ref. [20].
    Huiyuan Liu, He Wen, Guifang Li. Applications of weakly-coupled few-mode fibers [Invited][J]. Chinese Optics Letters, 2020, 18(4): 040601
    Download Citation