
Jiewen Yang, Guang Zhang, Xijiang Chen, Ya Ban. Quantitative Identification of Concrete Surface Cracks Based on Deep Learning Clustering Segmentation and Morphology[J]. Laser & Optoelectronics Progress, 2020, 57(22): 221023
- Laser & Optoelectronics Progress
- Vol. 57, Issue 22, 221023 (2020)
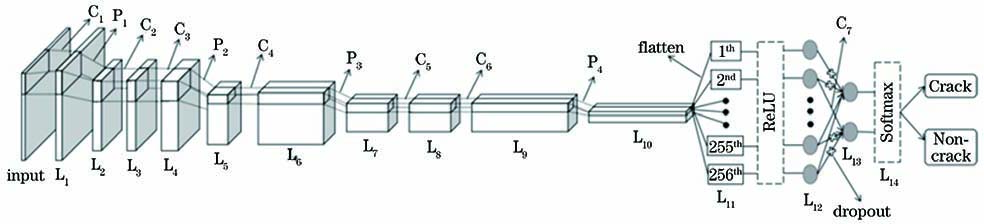
Fig. 1. Schematic of Crack Identification Net (CIN)
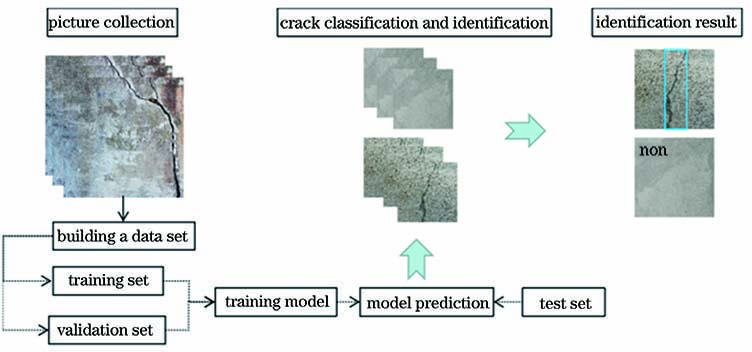
Fig. 2. Flowchart of identification
Fig. 3. Example of crack and non-crack images. (a) Crack images; (b) non-crack images
Fig. 4. Training and validation results for group 4th model. (a) Training results; (b) validation results
Fig. 5. Accuracy rate of training and validation for 5 different groups
Fig. 6. Example of identification results. (a) Original image; (b) crack classification and identification result
Fig. 7. Segmentation results obtained by the proposed algorithm and traditional methods. (a) Original image; (b) improved Otsu algorithm; (c) improved Canny algorithm; (d) improved median filter algorithm; (e) our algorithm
Fig. 8. Comparison of evaluation indicators of each algorithm
Fig. 9. Segmentation results obtained by the proposed algorithm and clustering methods. (a) Original image; (b) K-means algorithm; (c) mean shift algorithm; (d) fuzzy C-means algorithm; (e) our algorithm
Fig. 10. Comparison of evaluation indicators of each algorithm
Fig. 11. Identification of cracks with different thicknesses. (a) Original image; (b) identification of neural network; (c) segmentation; (d) mark
Fig. 12. Example of crack marking. (a) Crack 1; (b) crack 2
Fig. 13. Original crack images for quantitative calculation
|
Table 1. Pixel sizes of crack 1 and crack 2
| |||||||||||||||||||||||||||
Table 2. Actual size of cracks 1 and crack 2
| |||||||||||||||||||||||||||||||||||||||||||||||||||||||||||||||||||||||||||||||||||||||||||||||||||||||||||||||||||||||
Table 3. Comparison of statistical results
|
Table 4. Accuracy of statistical results

Set citation alerts for the article
Please enter your email address
© Copyright 2018-2021 | Chinese Laser Press. All Rights Reserved 沪ICP备15018463号-20