• Matter and Radiation at Extremes
  • Vol. 6, Issue 1, 014401 (2021)
Zhen-Chi Zhang1, Tao Yang1, Guang-Yue Hu1、2、a), Meng-Ting Li1, Wen Luo3, Ning An4、5, and Jian Zheng1、6
Author Affiliations
  • 1CAS Key Laboratory of Geospace Environment and Department of Engineering and Applied Physics, University of Science and Technology of China, Hefei, Anhui 230026, China
  • 2CAS Center for Excellence in Ultra-Intense Laser Science (CEULS), Shanghai 200031, China
  • 3School of Nuclear Science and Technology, University of South China, Hengyang 421001, China
  • 4National Synchrotron Radiation Laboratory, University of Science and Technology of China, Hefei, Anhui 230026, China
  • 5Anhui Specreation Instrument Technology Co., Ltd., Hefei, Anhui 230088, China
  • 6Collaborative Innovation Center of IFSA (CICIFSA), Shanghai Jiao Tong University, Shanghai 200240, China
  • show less
    DOI: 10.1063/5.0026005 Cite this Article
    Zhen-Chi Zhang, Tao Yang, Guang-Yue Hu, Meng-Ting Li, Wen Luo, Ning An, Jian Zheng. Compact broadband high-resolution Compton spectroscopy for laser-driven high-flux gamma rays[J]. Matter and Radiation at Extremes, 2021, 6(1): 014401 Copy Citation Text show less
    Mechanical structure of the Compton spectrometer. (a) Top view. (b) Side view. (c) Adjusting mechanism, allowing fine adjustment of translation, rotation, and pitch angle. The flanges around this mechanism limit the position and prevent the spectrometer from sliding.
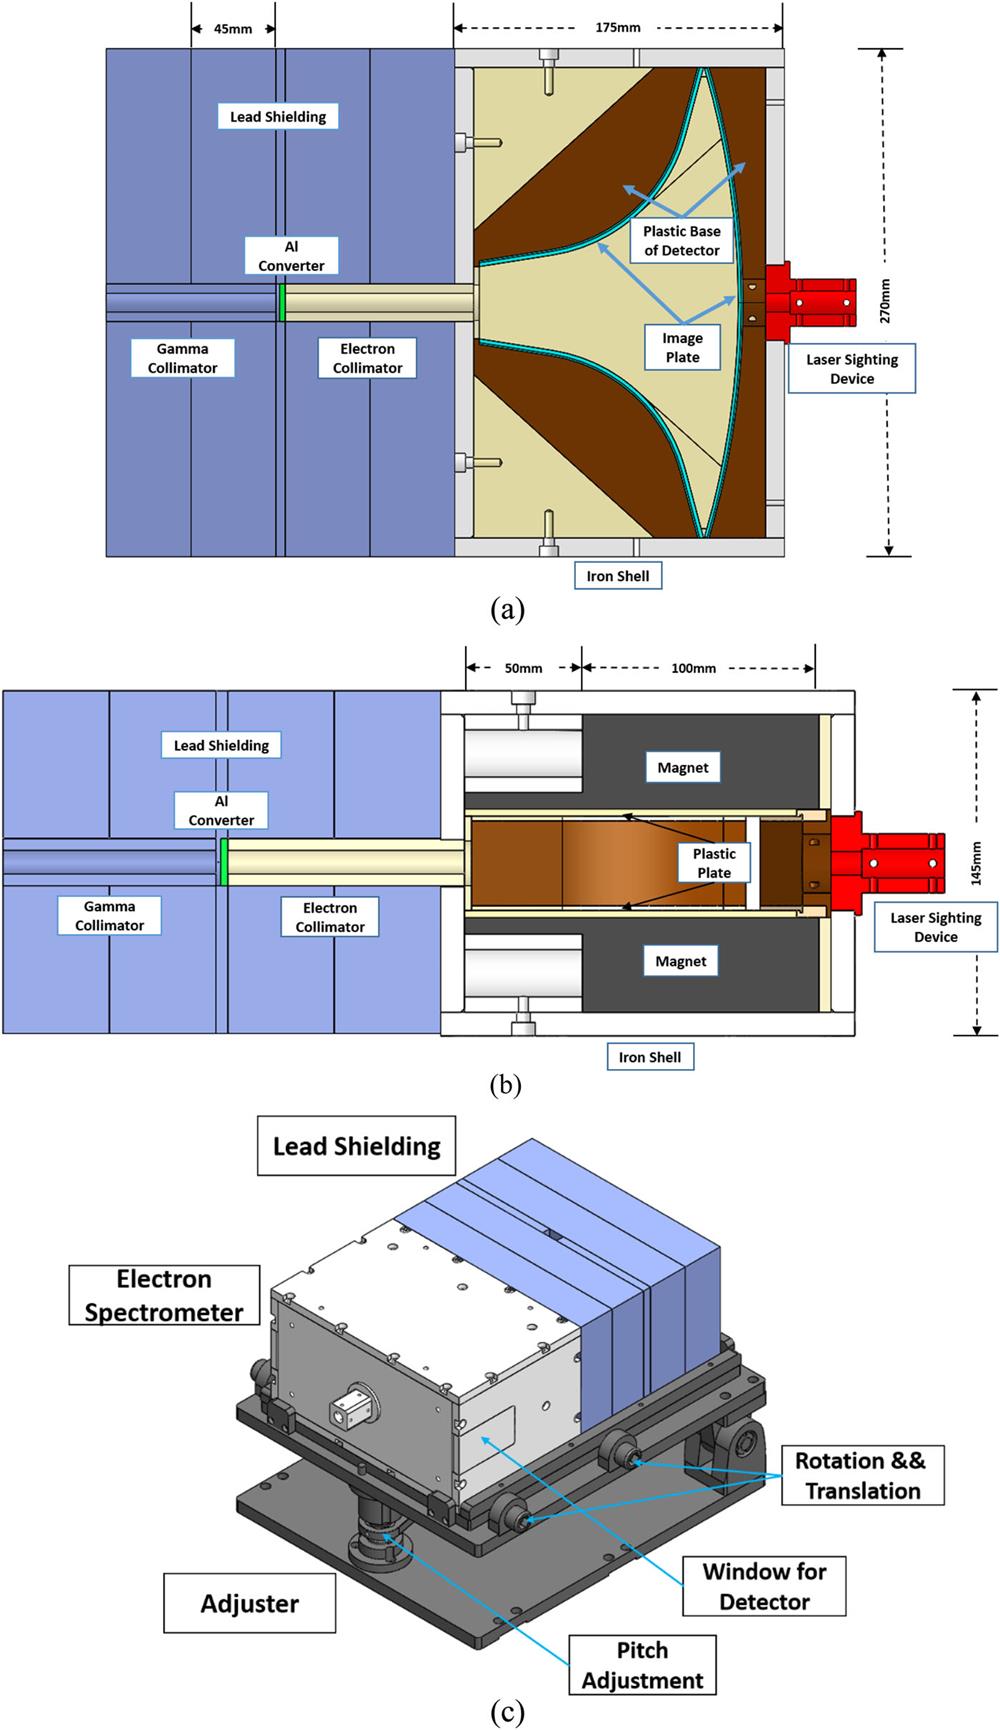
    Fig. 1. Mechanical structure of the Compton spectrometer. (a) Top view. (b) Side view. (c) Adjusting mechanism, allowing fine adjustment of translation, rotation, and pitch angle. The flanges around this mechanism limit the position and prevent the spectrometer from sliding.
    Magnetic field profile in the central (Y = 0) plane: (a) pseudocolor map; (b) contour image.
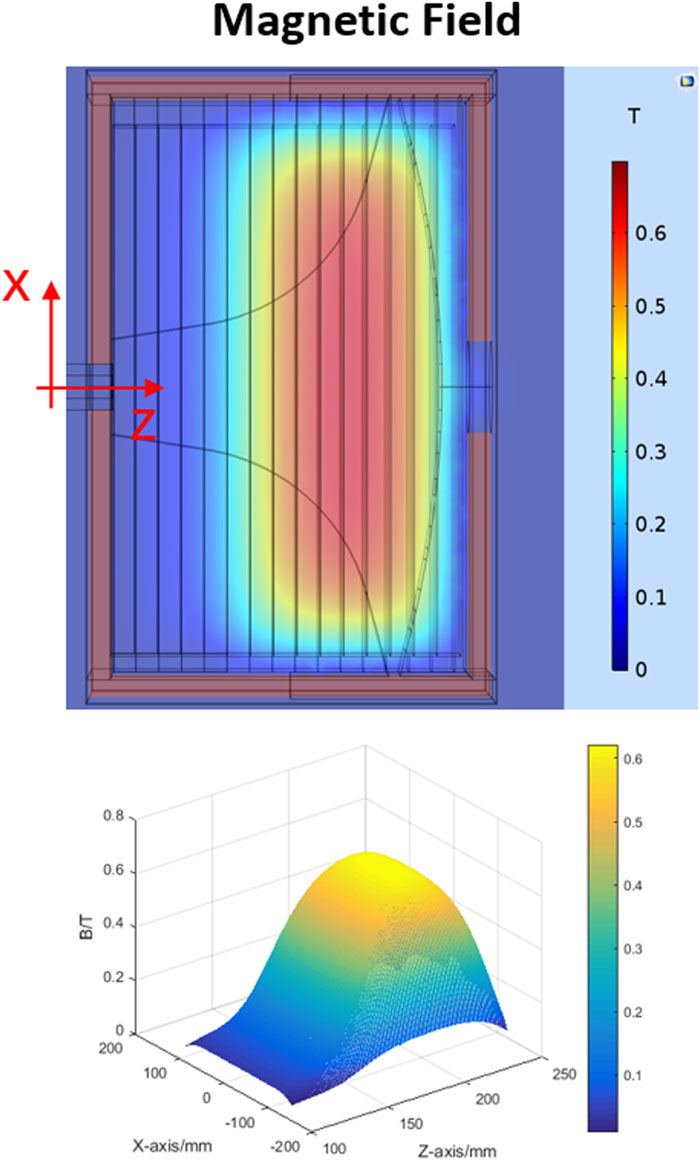
    Fig. 2. Magnetic field profile in the central (Y = 0) plane: (a) pseudocolor map; (b) contour image.
    Trajectories of electron beams dispersed in the nonuniform magnetic field. These trajectories represent incident electron beams with energies 0.5 MeV and 1 MeV–13 MeV at 1 MeV intervals (“first IP”). The trajectories of electron beams with energies 14 MeV–30 MeV are also shown (“second IP”).
    Fig. 3. Trajectories of electron beams dispersed in the nonuniform magnetic field. These trajectories represent incident electron beams with energies 0.5 MeV and 1 MeV–13 MeV at 1 MeV intervals (“first IP”). The trajectories of electron beams with energies 14 MeV–30 MeV are also shown (“second IP”).
    Simulation of the scattered electron energy spectrum emitted by aluminum converters of various thicknesses from 0.1 mm to 3 mm. The gamma rays are vertically incident on the converter with a photon energy of 6 MeV and a photon number of 1 × 10⁷. The collection angle of the scattered electrons is 0.0078 sr.
    Fig. 4. Simulation of the scattered electron energy spectrum emitted by aluminum converters of various thicknesses from 0.1 mm to 3 mm. The gamma rays are vertically incident on the converter with a photon energy of 6 MeV and a photon number of 1 × 10⁷. The collection angle of the scattered electrons is 0.0078 sr.
    Scattered electron spectrum at different electron collection angles. The gamma rays are vertically incident on the 1 mm aluminum converter with a photon energy of 6 MeV and a photon number of 1 × 10⁷.
    Fig. 5. Scattered electron spectrum at different electron collection angles. The gamma rays are vertically incident on the 1 mm aluminum converter with a photon energy of 6 MeV and a photon number of 1 × 10⁷.
    (a) and (b) Spectral curves (solid lines) of scattered electrons produced by a 1 mm aluminum converter for monoenergetic incident gamma rays with energies in the ranges 0.5 MeV–13 MeV and 15 MeV–30 MeV, respectively. Scattered positron signals for incident gamma rays with energies 12 MeV, 13 MeV, and 30 MeV are also shown (dashed lines). (c) and (d) Scattered electron spectral curves with the positron–electron pair signal subtracted for monoenergetic incident gamma rays with energies in the ranges 0.5 MeV–13 MeV and 15 MeV–30 MeV, respectively. In the simulations, the photon number in each monoenergetic incident beam was 5 × 10⁷. Note that the spectral curves for 15 MeV–30 MeV were recorded on the second IP.
    Fig. 6. (a) and (b) Spectral curves (solid lines) of scattered electrons produced by a 1 mm aluminum converter for monoenergetic incident gamma rays with energies in the ranges 0.5 MeV–13 MeV and 15 MeV–30 MeV, respectively. Scattered positron signals for incident gamma rays with energies 12 MeV, 13 MeV, and 30 MeV are also shown (dashed lines). (c) and (d) Scattered electron spectral curves with the positron–electron pair signal subtracted for monoenergetic incident gamma rays with energies in the ranges 0.5 MeV–13 MeV and 15 MeV–30 MeV, respectively. In the simulations, the photon number in each monoenergetic incident beam was 5 × 10⁷. Note that the spectral curves for 15 MeV–30 MeV were recorded on the second IP.
    Spectral curve of scattered electrons produced by a 0.25 mm aluminum converter and 0.5 MeV–13 MeV monoenergetic gamma rays (the positron–electron pair signal has been subtracted). The parameter settings are the same as in Fig. 6.
    Fig. 7. Spectral curve of scattered electrons produced by a 0.25 mm aluminum converter and 0.5 MeV–13 MeV monoenergetic gamma rays (the positron–electron pair signal has been subtracted). The parameter settings are the same as in Fig. 6.
    The minimum numbers of incident photons required to produce an effective scattered electron.
    Fig. 8. The minimum numbers of incident photons required to produce an effective scattered electron.
    (a) Spectral resolution of the Compton spectrometer with 0.25 mm and 1 mm Al converters in the primary detection region of 0.5 MeV–13 MeV. The results for other spectrometers12,20 are also shown. (b) Spectral resolution of the Compton spectrometer with a 1 mm Al converter in the secondary detection region of 15 MeV–30 MeV.
    Fig. 9. (a) Spectral resolution of the Compton spectrometer with 0.25 mm and 1 mm Al converters in the primary detection region of 0.5 MeV–13 MeV. The results for other spectrometers12,20 are also shown. (b) Spectral resolution of the Compton spectrometer with a 1 mm Al converter in the secondary detection region of 15 MeV–30 MeV.
    Numerical experiments on spectral reconstruction. (a) Original (blue line) and reconstructed (red line) gamma-ray spectra Sγ. (b) Scattered electron energy spectra Se without (blue line) and with (red line) 20 dB white noise.
    Fig. 10. Numerical experiments on spectral reconstruction. (a) Original (blue line) and reconstructed (red line) gamma-ray spectra Sγ. (b) Scattered electron energy spectra Se without (blue line) and with (red line) 20 dB white noise.
    Zhen-Chi Zhang, Tao Yang, Guang-Yue Hu, Meng-Ting Li, Wen Luo, Ning An, Jian Zheng. Compact broadband high-resolution Compton spectroscopy for laser-driven high-flux gamma rays[J]. Matter and Radiation at Extremes, 2021, 6(1): 014401
    Download Citation