1CAS Key Laboratory of Geospace Environment and Department of Engineering and Applied Physics, University of Science and Technology of China, Hefei, Anhui 230026, China
2CAS Center for Excellence in Ultra-Intense Laser Science (CEULS), Shanghai 200031, China
3School of Nuclear Science and Technology, University of South China, Hengyang 421001, China
4National Synchrotron Radiation Laboratory, University of Science and Technology of China, Hefei, Anhui 230026, China
5Anhui Specreation Instrument Technology Co., Ltd., Hefei, Anhui 230088, China
6Collaborative Innovation Center of IFSA (CICIFSA), Shanghai Jiao Tong University, Shanghai 200240, China
Zhen-Chi Zhang, Tao Yang, Guang-Yue Hu, Meng-Ting Li, Wen Luo, Ning An, Jian Zheng. Compact broadband high-resolution Compton spectroscopy for laser-driven high-flux gamma rays[J]. Matter and Radiation at Extremes, 2021, 6(1): 014401
Copy Citation Text
A compact broadband Compton spectrometer with high spectral resolution has been designed to detect spectra of laser-driven high-flux gamma rays. The primary detection range of the gamma-ray spectrum is 0.5 MeV–13 MeV, although a secondary harder gamma-ray region of 13 MeV–30 MeV can also be covered. The Compton-scattered electrons are spectrally resolved using a curved surface detector and a nonuniform magnetic field produced by a pair of step-like magnets. This design allows a compact structure, a wider bandwidth, especially in the lower-energy region of 0.5 MeV–2 MeV, and optimum spectral resolution. The spectral resolution is 5%–10% in the range 4 MeV–13 MeV and better than 25% in the range 0.5 MeV–4 MeV (with an Al converter of 0.25 mm thickness and a collimator of 1 cm inner diameter). Low-Z plastic materials are used on the inner surface of the spectrometer to suppress noise due to secondary X-ray fluorescence. The spectrometer can be adjusted flexibly via a specially designed mechanical component. An algorithm based on a regularization method has also been developed to reconstruct the gamma-ray spectrum from the scattered electrons.
I. INTRODUCTION
A relativistic ultrashort intense laser pulse (1018 W/cm2) interacting with a target can produce a large number of high-energy electrons, and these can then drive a high-flux continuous gamma-ray source.1 Such laser-plasma gamma-ray sources have many advantages, including high brightness and short pulse duration, and are therefore widely used. For example, in medical imaging, laser-based ultrafast gamma-ray sources can greatly improve the contrast and spatial resolution of X-ray radiography2 compared with sources using X-ray tubes. Gamma-ray diagnostics also play an important role in inertial confinement fusion, providing a way to directly measure the history of the fusion reaction and obtain information such as the areal density of the capsule.3,4 Therefore, precise diagnosis of the gamma-ray spectrum is important for optimization of gamma-ray sources and determination of material properties. Filter stack spectrometers, which are composed of multiple layers of filters and recording media, are often used to detect hard X rays from tens to hundreds of keV,5–8 but their spectral resolution is very low in the MeV range. Therefore, Compton spectrometers, based on the Compton scattering process,9 have been developed for MeV gamma-ray detection. A Compton spectrometer consists of a converter and an electron magnetic spectrometer. An incoming gamma ray interacts with the converter and produces scattered electrons. These scattered electrons are then spectrally resolved by the electron magnetic spectrometer. The spectrum of the incoming gamma ray can be obtained from that of the scattered electrons.
Kim et al.10 developed a Compton spectrometer for the National Ignition Facility. Benefitting from the use of an electromagnet, its spectral resolution was better than 5% in the range of E0 × (1 ± 20%), where E0 is the central energy, which was tunable from 2 MeV to 25 MeV. However, the electromagnet made the spectrometer very large and complex. It also resulted in a very narrow bandwidth. Henderson et al.11 developed a Compton spectrometer using permanent magnets for a multi-PW laser facility. It could measure gamma spectra from 3 MeV to 50 MeV, with a spectral resolution of 10%–15%. Corvan et al.12 designed a compact Compton spectrometer, also using permanent magnets, that had a 4%–12% spectral resolution in the range 3 MeV–20 MeV. However, all the spectrometers based on permanent magnets that have been developed to date are still large, limiting the positions at which they can be installed, and they are too heavy to be operated by a single person. They also cannot cover gamma rays with energies below 2 MeV, which is the energy region most relevant to many applications of gamma-ray radiography.
In the present study, we develop a new Compton spectrometer using permanent magnets and incorporating an improved design of electron magnetic spectrometer to further enhance spectral resolution, expand the measurement bandwidth (especially toward the lower-energy region), and reduce the size and weight of the spectrometer so that it can be manipulated by one person. A nonuniform magnetic field generated by a pair of step-like magnets is used to extend the measurement bandwidth. The primary measurement range is 0.5 MeV–13 MeV with higher spectral resolution, and a secondary higher-energy range of 13 MeV–30 MeV can also be covered, but with lower spectral resolution. A curved surface detector, which is placed at the imaging points of the electron beams after they have passed through the magnetic spectrometer, is designed to improve the spectral resolution. In the range 4 MeV–13 MeV, the spectral resolution is 5%–10%, and in the range 0.5 MeV–4 MeV, it is 10%–25% (using an Al converter of thickness 0.25 mm and a collimator of inner diameter 1 cm). The size of the electron magnetic spectrometer is reduced to 175 × 270 × 145 mm3, and its weight is reduced to 24 kg. Among all the Compton spectrometers that have been described in the literature, the present spectrometer has the smallest volume, the lowest energy (0.5 MeV) at the lower boundary of spectral coverage, and the best spectral resolution (at the same size and similar bandwidth). In the inner surface of the electron magnetic spectrometer, low-Z materials are used to suppress noise due to secondary X-ray fluorescence. The separated design of the scattered electron magnetic spectrometer and the shielding/collimating components mean that this Compton spectrometer can be easily installed and adjusted with the help of an adjusting mechanism. The performance of the spectrometer has been verified by Monte Carlo simulation, and a spectral reconstruction method based on Tikhonov regularization has been developed.
II. DESIGN OF COMPTON SPECTROMETER
A. Principle of Compton spectrometer
The Compton spectrometer is based on the Compton scattering process. The extranuclear electrons of the converter collide with incident photons, gaining energy and escaping from the nucleus as free electrons. The energy of a scattered free electron is13where Eγ is the energy of the incident photon, φ is the angle between the directions of the incident photon and the escaped electron, and me is the electron mass. It can be seen from Eq. (1) that the kinetic energy of the scattered electron Ee and the incident photon energy Eγ have a one-to-one relationship if the value of φ is limited. For example, for φ = 0, the maximum value of Ee can be obtained as
Based on Eq. (2), the spectrum of the incident gamma rays Sγ can be obtained by measuring the kinetic energy spectrum of the scattered electrons Se according to the following relationship:where R is the response matrix of the Compton spectrometer. By solving Eq. (3), the gamma-ray spectrum Sγ can be reconstructed as
It should be noted that Eq. (1) is only valid for a single scattering process. Multiple scattering of incident gamma photons will destroy the one-to-one relationship between Ee and Eγ, leading to distortion of the reconstructed gamma-ray spectrum. Moreover, there are two other electron-producing effects in the gamma–atom interaction process: the photoionization effect and the electron–positron pair effect.14 The cross-section for the photoionization effect is proportional to ,15 and the kinetic energy of the photoionized electron is far lower than that of the incident photon, so the photoionization effect can generally be ignored. However, when the incident gamma-ray energy exceeds 1.022 MeV, electron–positron pair production will occur. The cross-section σ for this process can be obtained as16where α is the fine structure constant, re is the classical electron radius, Z is the atomic number of the converter material, and P(E,z) is a complex function depending on photon energy E and atomic number Z. It can be seen that σ is proportional to Z2. Therefore, it is necessary to use low-Z materials in the converter to reduce electron–positron pair production. As the solid material with the smallest atomic number, lithium would be the most suitable material for the converter if it were not for the fact that it is easily oxidized in air. Therefore, for reasons of safety and convenient application, we chose aluminum as the converter material. In addition, since the positrons and electrons are always produced in pairs, the influence of the electron–positron pair effect can be largely eliminated through their mutual cancellation by the adoption of a symmetrical design for the spectrometer such that the positron and electron spectra are measured simultaneously.
B. Mechanical design of the Compton spectrometer
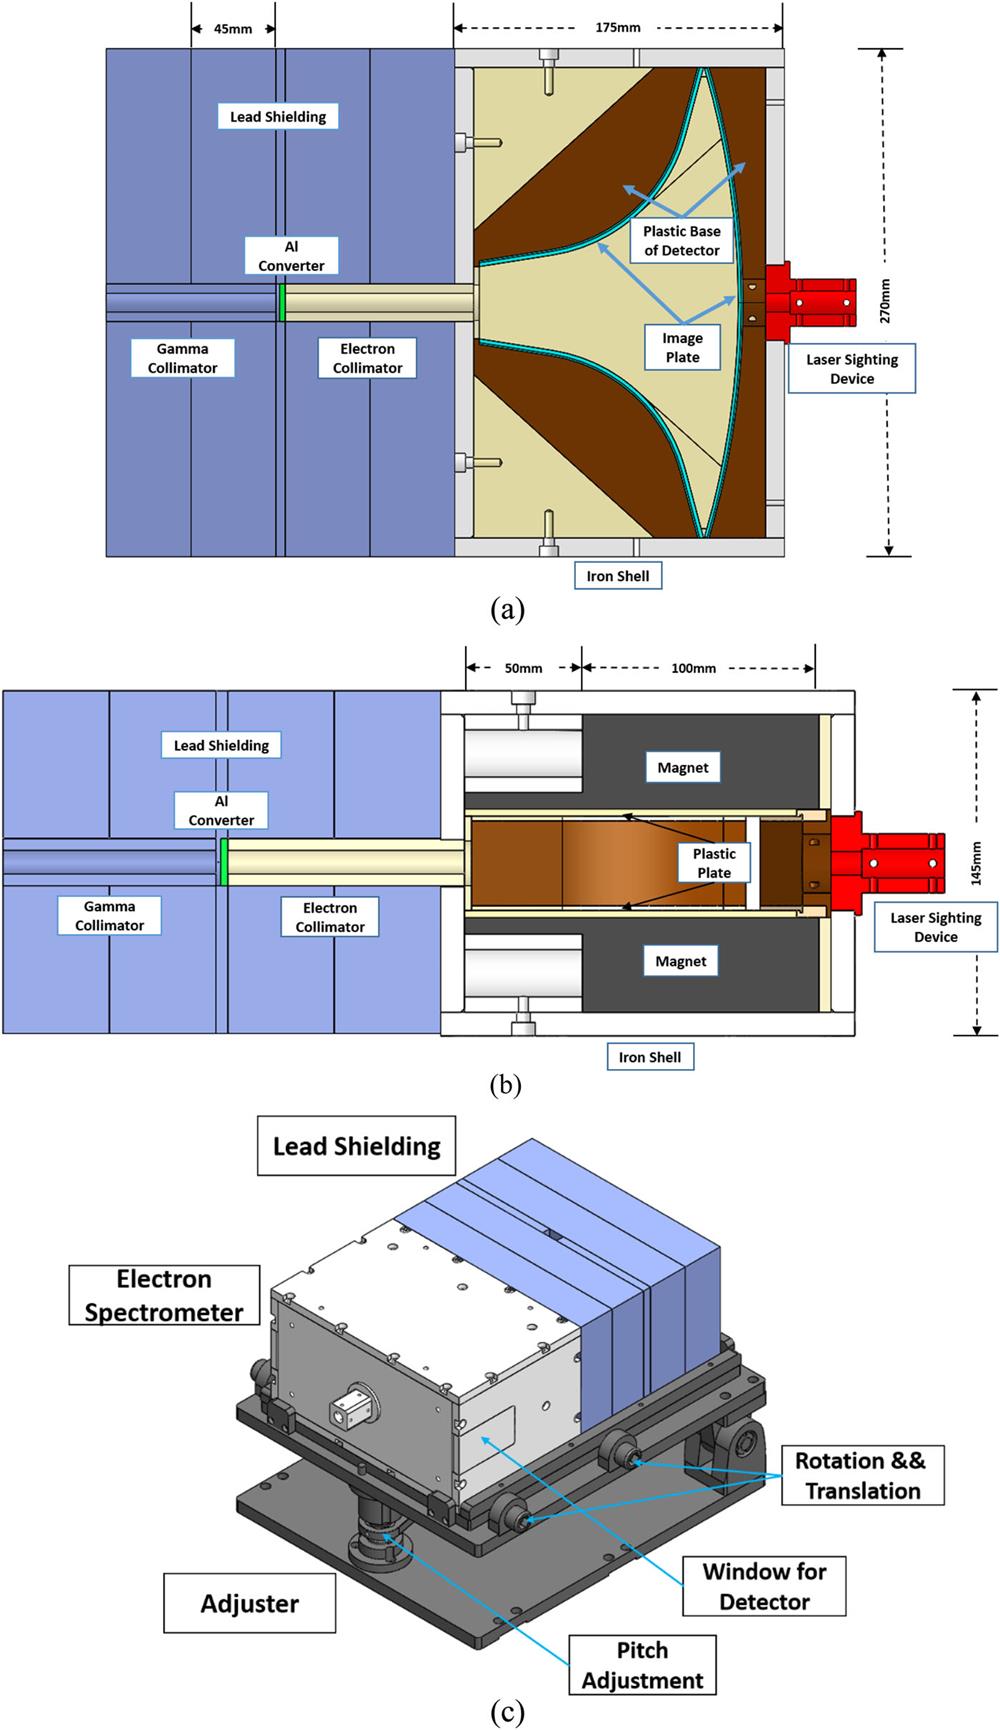
The overall mechanical structure of the spectrometer is shown in Fig. 1(a). The spectrometer is composed of two separate parts: the shielding/collimator component and the electron magnetic spectrometer.
Figure 1.Mechanical structure of the Compton spectrometer. (a) Top view. (b) Side view. (c) Adjusting mechanism, allowing fine adjustment of translation, rotation, and pitch angle. The flanges around this mechanism limit the position and prevent the spectrometer from sliding.
The shielding/collimator component consists of five lead bricks with a total thickness of 185 mm. Of these bricks, four have masses of 20 kg and dimensions of 270 mm (width) × 145 mm (height) × 45 mm (thickness), while the thinner brick in the middle is only 5 mm thick. There is a 5 × 20 mm2 square hole through the tops of the bricks to facilitate placement of the converter from above. The purpose of these lead bricks is to provide shielding from direct gamma-ray penetration. The residual intensity of the 20 MeV gamma-ray beam behind the lead shielding is three orders of magnitude lower than that of the scattered electron signal. A collimator with an inner diameter of 10 mm in the center of the lead bricks is used to constrain the solid angle of the incident photons and the scattered electrons such that the condition φ ≈ 0 is satisfied.
The shell of the electron magnetic spectrometer is made of iron of thickness 10 mm. The spectrometer has dimensions 175 × 270 × 145 mm3 and mass 24 kg. Compared with the spectrometers described previously in the literature,10–12 ours is very light and compact. As mentioned above, it adopts a symmetrical design so that the positron and background noise can be subtracted from the electron signal. To improve the spectral resolution, a detector with a curved surface is used [see the brown areas in Figs. 1(a) and 1(b), which show the plastic base of the detector] to allow it to be placed as close as possible to the focusing imaging position of the electron beam after this has passed through the magnetic field region, as will be described in detail in Sec. II C. We chose a Fuji BAS-SR (or BAS-MS) image plate (IP) as the recording detector owing to its easy bending and replacement.17,18 The detection slider is made of polytetrafluoroethylene (PTFE) and has a slot for fixing the IP. There is a guide rail that matches with the slider inside the spectrometer, and the slider can be easily replaced via the window shown in Fig. 1(c). The primary measurement range of the spectrometer is 0.5 MeV–13 MeV. For secondary coverage of gamma-ray signals in the higher-energy range 13 MeV–30 MeV, albeit with much lower spectral resolution, a detection screen is also placed at the back of the spectrometer.
As shown in Fig. 1(b), we use a pair of stepped neodymium (NdFeB) magnets to produce a nonuniform magnetic field distribution, This nonuniform field balances the dispersion of low-energy and high-energy electrons, allowing the spectrometer to achieve a wide measurement range while remaining compact. The thin front magnet is 50 mm long and 10 mm thick, while the thicker back magnet is 100 mm long and 30 mm thick. The magnets wrapped with a 10 mm thick iron shell, which, being magnetically conducting, enhances the internal magnetic field strength and prevents leakage of the magnetic field, as well as providing shielding from stray gamma rays.
We found that secondary X-ray fluorescence is produced when the electrons strike the surfaces of the magnets, which generates background noise on the IP. To suppress this X-ray fluorescence noise, four measures are adopted. First, either a plastic sheet of thickness 1 mm or an additional pair of magnets is placed in front of the converter to block externally incident electrons. Second, a PTFE electron beam collimator (inner diameter 10 mm, outer diameter 20 mm, and length 100 mm) is used to prevent excitation of stray X-ray fluorescence in the hole of the collimator by scattered electrons with larger scattering angles. Third, as shown in Fig. 1(b), the inner surfaces of the magnet pair and the iron shell of the spectrometer, which the electrons might strike, are covered with a 3 mm thick layer of PTFE to prevent stray X-ray fluorescence production in the spectrometer. Fourth, the detection screen is placed in the shadow area of the collimating hole to protect it from directly transmitted gamma-ray signals.
Although our electron magnetic spectrometer is very light compared with others,10–12 it still weighs 24 kg (the weight of the lead shielding component cannot be reduced markedly), and steering and pitching adjustments remain inconvenient. To deal with this problem, we have designed a matching adjusting mechanism, as shown in Fig. 1(c). The spectrometer is placed on this mechanism and can be rotated and translated over small ranges under control of the lateral screw. The pitch angle of the spectrometer can be adjusted by means of the spherical wrench under the bracket. In addition, we have designed a laser sighting device that is placed at the end of the spectrometer and is used in combination with the adjusting mechanism to easily align the spectrometer with the gamma-ray source.
C. Simulation of magnetic field profile and electron beam trajectory
The electron magnetic spectrometer component is the core of the Compton spectrometer. We simulated the magnetic field distribution and electron beam deflection using the COMSOL Multiphysics code19 to achieve the goals of a wide spectral measurement range and high spectral resolution.
Conventional Compton spectrometers11,12 use uniform magnetic field profiles to measure electron spectra. Although a uniform magnetic field profile is convenient in terms of ease of manufacture and spectral reconstruction, it also results in excessive deflection of low-energy electrons and insufficient deflection of high-energy electrons, thereby limiting both spectral resolution and the measurement bandwidth. To preserve compactness and achieve a wide spectral bandwidth with a higher spectral resolution, we adopt a nonuniform magnetic field distribution, as shown in Fig. 2. At the front end, the magnetic field is weaker, only 0.05 T, and the low-energy electrons passing through this region are not excessively deflected. At the rear end, the magnetic field is stronger, reaching 0.6 T, which provides sufficient dispersion for the high-energy electrons.
Figure 2.Magnetic field profile in the central (Y = 0) plane: (a) pseudocolor map; (b) contour image.
Figure 3 shows the deflection of 0.5 MeV–30 MeV electron beams in the nonuniform magnetic field. The monoenergetic electron beams are incident into the magnetic field region from a point source with a divergence angle of 0.0078 sr (this is the collection angle of the electron collimator with 1 cm inner diameter). It is found that owing to the stepped magnetic field profile, low-energy electrons in the range 0.5 MeV–6 MeV propagating in the weak magnetic field are not deflected too strongly, and high-energy electrons in the range 6 MeV–13 MeV propagating in the strong magnetic field have sufficient dispersion.
Figure 3.Trajectories of electron beams dispersed in the nonuniform magnetic field. These trajectories represent incident electron beams with energies 0.5 MeV and 1 MeV–13 MeV at 1 MeV intervals (“first IP”). The trajectories of electron beams with energies 14 MeV–30 MeV are also shown (“second IP”).
It can also be seen from Fig. 3 that the electron beams produce focused imaging points after passing through the magnetic field region, which generates the highest spectral resolution at the imaging point. In conventional Compton spectrometers, the detectors that receive the dispersed electrons are planar structures,11,12,20 for which only electrons with specific energy reach the imaging point, and consequently high spectral resolution can be obtained only in a specific narrow range. To further improve the spectral resolution, we have designed a curved surface detection screen (the first IP), which is positioned at the imaging points of the 0.5 MeV–13 MeV dispersed electron beams. This enables the highest spectral resolution to be achieved in a broadband range from 0.5 MeV to 13 MeV.
The imaging points of higher-energy electrons (>13 MeV) are outside the magnetic field region. To retain the compactness of the electron magnetic spectrometer, we give up the requirement of high spectral resolution for these higher-energy electron beams. We measure the dispersed electrons with energies above 13 MeV at the out-of-focus position (the second IP), and this allows coverage of a broadband energy range up to 30 MeV. Although the resolution is poor in this secondary region, it can still be used to provide reference data for analysis. The scattered electron spectrum above 30 MeV will be smeared by stray gamma rays directly incident on the converter, which places an upper limit on the detection region.
D. Design of the converter and the collimator
To determine the thickness of the Al converter and the size of the Pb collimator, we used the GEANT4 Monte Carlo code21 to simulate the Compton scattering and the dispersion of the scattered electron beam in the magnetic field, as in our previous work.20 The results are shown in Figs. 4 and 5.
Figure 4.Simulation of the scattered electron energy spectrum emitted by aluminum converters of various thicknesses from 0.1 mm to 3 mm. The gamma rays are vertically incident on the converter with a photon energy of 6 MeV and a photon number of 1 × 10⁷. The collection angle of the scattered electrons is 0.0078 sr.
Figure 5.Scattered electron spectrum at different electron collection angles. The gamma rays are vertically incident on the 1 mm aluminum converter with a photon energy of 6 MeV and a photon number of 1 × 10⁷.
Figure 4 shows that to provide higher spectral resolution and an intense scattered electron signal, the optimal thickness of the converter is around 1 mm for photons with an energy of 6 MeV. A thinner converter would lead to a weaker scattered electron signal but a narrower electron spectrum. A thicker converter would lead to a wider scattered electron spectrum due to multiple scattering, which would result in lower spectral resolution but a more intense electron signal.
Figure 5 shows the influence of the electron collection angle on the energy spectrum of the scattered electrons. It is found that a larger collection angle will decrease the spectral resolution but increase the signal intensity. We chose a collimator with a length of 100 mm and an inner diameter of 10 mm, corresponding to a collection angle of 0.0078 sr normally. We also prepared a series of collimator tubes with different collection angles.
E. Response function and spectral resolution
To calculate the response matrix R from the gamma-ray spectrum to the electron spectral curve, we used the GEANT4 Monte Carlo code to simulate the entire process of operation of the Compton spectrometer, including Compton scattering in the converter, electron beam dispersion in the magnetic field, and deposition of the energy of the scattered electrons in the IP. The standard electromagnetic process library was used in the GEANT4 simulation, which considered the photoelectric effect, Compton scattering, and the electron pair effect for the gamma photons, the ionization, bremsstrahlung, and multiple scattering effects for the electrons, and the annihilation effect for the positrons.
Figure 6(a) shows the spectral curves of the scattered electrons on the IP detector produced by monoenergetic incident photons of 0.5 MeV–13 MeV. The spectral curves of the scattered positrons produced by monoenergetic incident photons of 12 MeV and 13 MeV are also shown as dashed lines. The signal intensity has been converted into count values of the IP, and the statistical spatial interval is 1 mm. The relationship between the energy deposition of particles in the IP and the count value has been experimentally calibrated.22 For a photomultiplier tube voltage of 1000 V, a pixel size of 50 µm, and a latitude L = 4, the conversion coefficient is 4.33 counts/keV for the Fuji BAS-SR IP and 20.45 counts/keV for the BAS-MS IP. It is found that for low-energy gamma rays (0.5 MeV–4 MeV), the intensity of the spectral curve is lower, which means that the sensitivity of the spectrometer is lower for low-energy gamma rays. Moreover, the full width at half maximum (FWHM) of the spectral curve is larger, which means that the multiple-scattering effect in the converter is more serious for low-energy gamma rays, leading to poorer spectral resolution. In the energy range 5 MeV–10 MeV, the spectral curves have higher intensity and a narrow FWHM, indicating that the thickness of the converter is appropriate for 5 MeV–10 MeV gamma rays. In that range, single scattering is the dominant process, which results in higher spectral resolution. In the higher-energy range 11 MeV–13 MeV, the intensity of the spectral curve decreases, indicating that the converter is too thin for high-energy gamma rays, and a large number of photons pass through it without scattering. Meanwhile, a tail of low-energy electrons are generated by the higher-energy gamma rays as a result of the electron pair effect. The influence of these low-energy electrons can be removed by a symmetrical subtraction of the positron signal, as shown in Fig. 6(c).
Figure 6.(a) and (b) Spectral curves (solid lines) of scattered electrons produced by a 1 mm aluminum converter for monoenergetic incident gamma rays with energies in the ranges 0.5 MeV–13 MeV and 15 MeV–30 MeV, respectively. Scattered positron signals for incident gamma rays with energies 12 MeV, 13 MeV, and 30 MeV are also shown (dashed lines). (c) and (d) Scattered electron spectral curves with the positron–electron pair signal subtracted for monoenergetic incident gamma rays with energies in the ranges 0.5 MeV–13 MeV and 15 MeV–30 MeV, respectively. In the simulations, the photon number in each monoenergetic incident beam was 5 × 10⁷. Note that the spectral curves for 15 MeV–30 MeV were recorded on the second IP.
The spectral curves for the secondary detection range from 13 MeV to 30 MeV are also provided in Figs. 6(b) and 6(d). In this un-optimized region, the spectral curves have wider peaks, which will cause poor spectral resolution. In addition, the pair effect increases significantly for higher-energy gamma rays of 30 MeV, which means that symmetrical subtraction of the positron signal is more important for spectral detection of high-energy gamma rays.
We also present the spectral curves of scattered electrons generated by a 0.25 mm Al converter in Fig. 7. As expected, the use of a thinner converter reduces the FWHM of the spectral curves, which will improve the spectral resolution. However, the intensity of the spectral curves decreases, leading to low sensitivity of the Compton spectrometer. In practical applications, the thickness of the converter can be selected flexibly according to the experimental conditions and the requirements with regard to spectral resolution.
Figure 7.Spectral curve of scattered electrons produced by a 0.25 mm aluminum converter and 0.5 MeV–13 MeV monoenergetic gamma rays (the positron–electron pair signal has been subtracted). The parameter settings are the same as in Fig. 6.
The sensitivity of the Compton spectrometer can be inferred using the simulated response matrix. We integrate the scattered electron spectrum to obtain the number of scattered electron numbers by monoenergetic incident gamma rays, which is an immediate result from calculation of the spectral curves of Fig. 6. We can thus find the minimum number of incident photons required to generate one effective scattered electron (the positron–electron pairs have been subtracted). Figure 8 shows the results for both the 1 mm and 0.25 mm converters. For the 1 mm converter, the sensitivity approaches the saturated value and changes only slowly in the high-energy gamma-ray region from 2 MeV to 30 MeV. For 2 MeV gamma rays, 1.6 × 10⁴ photons are needed to produce one scattered electron. The sensitivity increases slowly toward the high-energy gamma-ray region, with the minimum photon number decreasing to 5 × 10³ for 6 MeV and to 1.6 × 10³ photons for 30 MeV. The sensitivity increases rapidly as the gamma-ray energy increases from 0.5 MeV to 2 MeV. At 0.5 MeV, 1.3 × 10⁵ photons are needed to generate one scattered electron.
Figure 8.The minimum numbers of incident photons required to produce an effective scattered electron.
The sensitivity with a thin converter of 0.25 mm exhibits an interesting characteristic that will be of benefit to low-energy gamma-ray spectrum detection. As expected, in the high-energy gamma-ray region, the sensitivity with a thin converter is used is lower than that with a thick one. For example, at gamma-ray energies of 6 MeV and 2 MeV, respectively, 1.2 × 10⁴ photons and 3.1 × 10⁴ photons are needed, which are respectively 2.4 and 1.9 times the numbers required with a 1 mm converter. However, in the lower-energy gamma-ray region below 2 MeV, the sensitivity decreases more slowly than in the case of a thick converter. At 0.5 MeV, the sensitivity with a thin converter is not significantly different from that with a thick converter: 1.2 × 10⁵ photons are needed to produce one scattered electron in the case of a 0.25 mm converter, which is close to the 1.6 × 10⁵ photons required with a 1 mm converter. Thus, thin converters preferred for the detection of low-energy gamma rays in the range 0.5 MeV–2 MeV, since they have similar sensitivity to thick converters, but higher spectral resolution (see below).
The spectral resolution of the Compton spectrometer in Fig. 9(a) is obtained as the ratio between the FWHM of the spectral curve dE (in Figs. 6 and 7) and the incident gamma-ray photon energy E. The results for other Compton spectrometers12,20 are also shown for comparison. The blue line represents the resolution at 2 MeV–20 MeV of our previous compact spectrometer,20 which used a planar IP detector and a nonuniform magnetic field profile. The green line represents the resolution of a spectrometer using a uniform magnetic field and a planar detector.12 The red and black lines represent the resolutions of our present spectrometer using aluminum converters of 0.25 mm and 1 mm thickness, respectively. Owing to its use of a stepped magnetic field and a curved surface detector, our present spectrometer has an extended measuring range down to a low-energy boundary of 0.5 MeV. The spectral resolution is also greatly improved compared with previous spectrometers. The resolution improves to 15% at 3 MeV, and is better than 10% in the higher-energy range above 4 MeV. The highest resolution approaches 5%. However, in the secondary detection region of 15 MeV–30 MeV, there is a significant deterioration in spectral resolution, with values of 20%–70% for the 1 mm Al converter.
Figure 9.(a) Spectral resolution of the Compton spectrometer with 0.25 mm and 1 mm Al converters in the primary detection region of 0.5 MeV–13 MeV. The results for other spectrometers12,20 are also shown. (b) Spectral resolution of the Compton spectrometer with a 1 mm Al converter in the secondary detection region of 15 MeV–30 MeV.
It is likely that the resolution of the spectrometer can be further improved in three aspects. First, as we mentioned earlier, the use of a thinner converter can reduce the multiple scattering of photons and thereby increase the spectral resolution. As shown in Fig. 7, the resolution using a 0.25 mm aluminum converter is significantly better than that with a 1 mm converter, while still achieving a similar sensitivity to the thicker converters in the low-energy region near 0.5 MeV. Second, by using a smaller collimator, the constraint condition φ = 0 could be more strictly satisfied, which would improve the resolution. Third, as can be seen from Fig. 5, the focusing quality of the lowest-energy part of the electron beam is presently not good enough. Therefore, the magnetic field profile could be further optimized to improve the resolution. Of course, the resolution could also be improved markedly by increasing the volume of the spectrometer and thus elongating the electron dispersion distance as in previous spectrometers.10–12
F. Spectral reconstruction method
Using the response matrix from Fig. 6 or Fig. 7 and the measured scattered electron energy spectrum, the gamma-ray spectrum can be reconstructed using Eq. (4). However, R is normally an ill-conditioned matrix. To solve this ill-conditioned matrix problem,23,24 we adopt the Tikhonov regularization method. The final solution is thenwhere λ is the regularization parameter, which can be determined using the L-curve method.25 We demonstrate the effectiveness of this regularization method for spectral reconstruction through numerical experiments.
Compton spectrometers are mainly applied to the measurement of continuous spectra, usually bremsstrahlung spectra. Therefore, we assumed an exponential decay profile for the incident gamma-ray spectrum Sγ. We then calculated the corresponding electron spectrum Se using Eq. (2). We added 20 dB white noise to the electron spectrum Se and then performed the inverse solution procedure using Eq. (6). The results are shown in Fig. 10. It can be seen that the reconstructed gamma-ray spectrum is in good agreement with the original spectrum, except for some numerical oscillations at the two ends of the spectrum.
Figure 10.Numerical experiments on spectral reconstruction. (a) Original (blue line) and reconstructed (red line) gamma-ray spectra Sγ. (b) Scattered electron energy spectra Se without (blue line) and with (red line) 20 dB white noise.
We have designed a compact high-resolution broadband Compton spectrometer to measure gamma-ray energy spectra primarily in the range from 0.5 MeV to 13 MeV but also in the secondary higher-energy range from 13 MeV to 30 MeV. The spectral resolution is better than 10%–22% for 0.5 MeV–4 MeV and 5%–10% for 4 MeV–13 MeV, and could be further optimized by using a thinner converter and a smaller collection angle. The spectrometer is smaller and lighter than previous Compton spectrometers and can be operated by a single person. It provides broadband spectral coverage, especially at lower energies, and high resolution with a limited volume. It also has the advantages of easy adjustment and low X-ray fluorescence noise, which make it particularly suitable for detection of gamma rays driven by intense lasers or electron beams. This spectrometer has already been successfully used for the detection of high-flux gamma-ray sources.
AUTHORS’ CONTRIBUTIONS
Z.-C.Z. and T.Y. contributed equally to this work.
References
[1] H.-S. Park, H.-K. Chung, D. M. Chambers et al. High-energy Kα radiography using high-intensity, short-pulse lasers. Phys. Plasmas, 13, 056309(2006).
[2] C. C. Chamberlain, Z. Jiang, E. Scalzetti, J. C. Kieffer, A. Krol, Z. Ichalalene. Future of laser-based X-ray sources for medical imaging. Appl. Phys. B, 74, s75-s81(2002).
[3] N. Hoffman, H. W. Herrmann, D. C. Wilson et al. Diagnosing inertial confinement fusion gamma ray physics (invited). Rev. Sci. Instrum., 81, 10D333(2010).
[4] Y. H. Kim, H. W. Herrmann, N. M. Hoffman et al. Measurement of areal density in the ablators of inertial-confinement-fusion capsules via detection of ablator (n, n′γ) gamma-ray emission. Phys. Plasmas, 20, 042705(2013).
[5] R. Behrens, R. Nolte, M. Schnürer et al. A TLD-based few-channel spectrometer for x ray fields with high fluence rates. Radiat. Prot. Dosim., 84, 367-370(1999).
[6] P. Ambrosi, R. Behrens. A TLD-based few-channel spectrometer for mixed photon, electron, and ion fields with high fluence rates. Radiat. Prot. Dosim., 101, 73-76(2002).
[7] J. A. King, C. D. Chen, M. H. Key et al. A Bremsstrahlung spectrometer using k-edge and differential filters with image plate dosimeters. Rev. Sci. Instrum., 79, 10E305(2008).
[8] R. Behrens. A spectrometer for pulsed and continuous photon radiation. J. Instrum., 4, P03027(2009).
[9] A. H. Compton. A quantum theory of the scattering of x-rays by light elements. Phys. Rev., 21, 483-502(1923).
[10] Y. Kim, H. W. Herrmann, T. J. Hilsabeck et al. Gamma-to-electron magnetic spectrometer (GEMS): An energy-resolved gamma-ray diagnostic for the National Ignition Facility. Rev. Sci. Instrum., 83, 10D311(2012).
[11] N. Riley, E. Liang, A. Henderson et al. Ultra-intense gamma-rays created using the Texas Petawatt Laser. High Energy Density Phys., 12, 46-56(2014).
[12] D. J. Corvan, M. Zepf, G. Sarri. Design of a compact spectrometer for high-flux MeV gamma-ray beams. Rev. Sci. Instrum., 85, 065119(2014).
[13] A. T. Nelms. Graphs and the Compton energy-angle relationship and the Klein-Nishina formula from 10 keV to 500 MeV. Phys. Today, 7, 18(1953).
[14] R. D. Evans. The Atomic Nucleus, 673-712(1955).
[15] K. Siegbahn, C. M. Davisson. Interaction of γ-Radiation with Matter Alpha-, Beta- and Gamma-Ray Spectroscopy, 37-78(1965).
[16] L. D. Landau, E. M. Lifshitz. The Classical Theory of Fields(1980).
[17] B. R. Maddox, H. S. Park, B. A. Remington et al. High-energy x-ray backlighter spectrum measurements using calibrated image plates. Rev. Sci. Instrum., 82, 023111(2011).
[18] Y. Honda, S. Okuda, R. Kodama, T. Sato, T. Takahashi, T. Yabuuchi, T. Ikeda, Y. Kitagawa, K. A. Tanaka. Calibration of imaging plate for high energy electron spectrometer. Rev. Sci. Instrum., 76, 013507(2005).