
Linwei Zhu, Yaoyu Cao, Qiuqun Chen, Xu Ouyang, Yi Xu, Zhongliang Hu, Jianrong Qiu, Xiangping Li. Near-perfect fidelity polarization-encoded multilayer optical data storage based on aligned gold nanorods[J]. Opto-Electronic Advances, 2021, 4(11): 210002-1
- Opto-Electronic Advances
- Vol. 4, Issue 11, 210002-1 (2021)
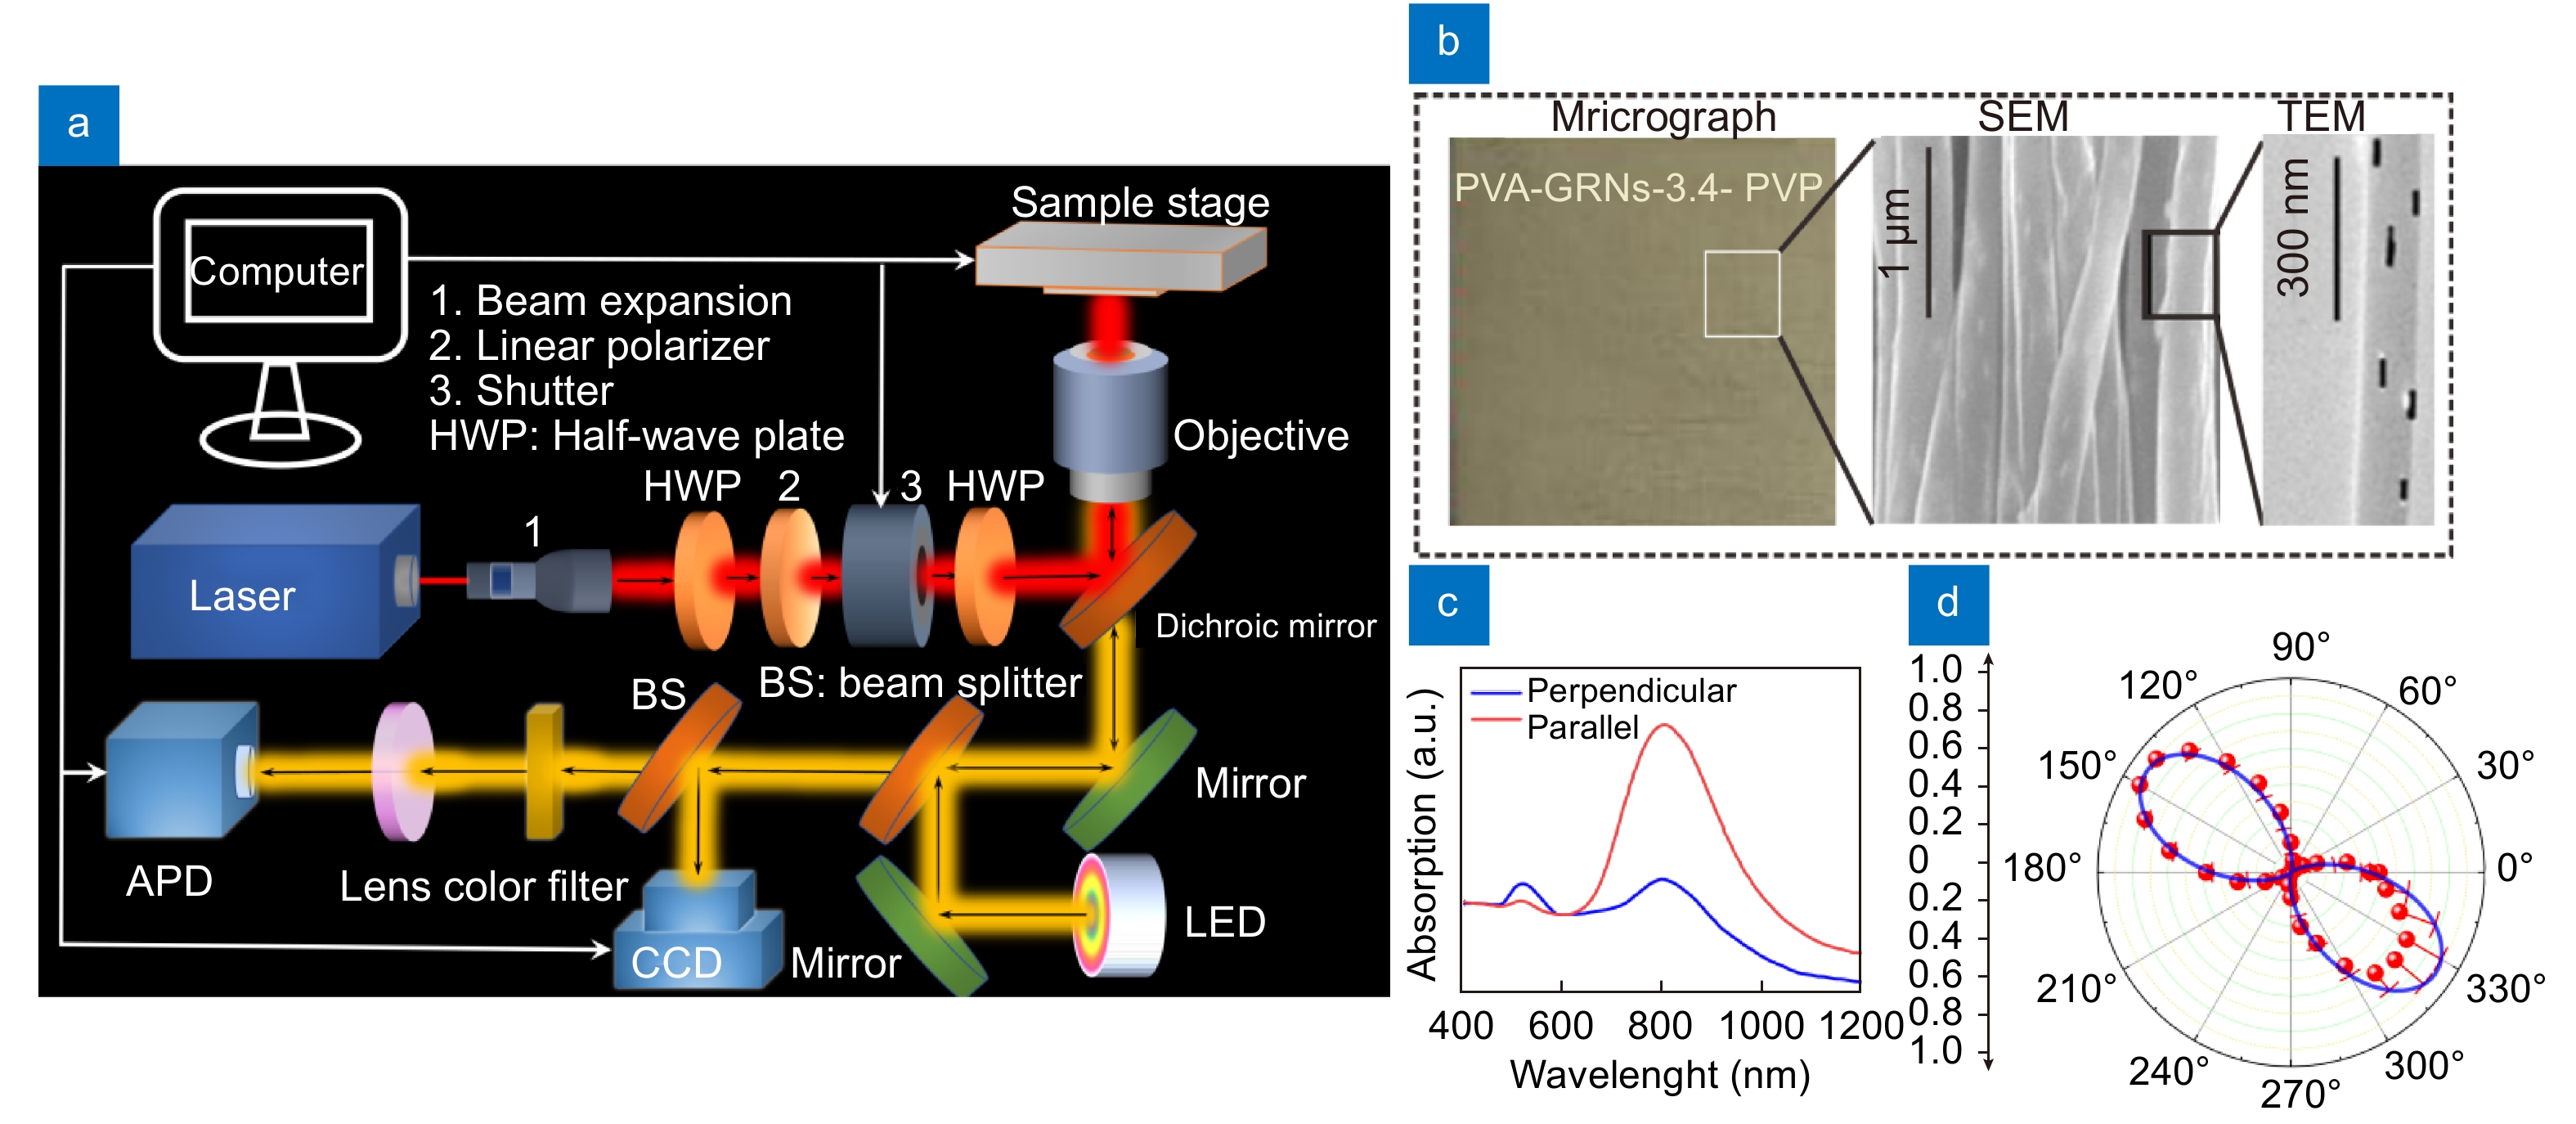
Fig. 1. (a ) Schematic drawing of the optical setup for the multilayered optical data storage. (b ) The optical microscope image of the data storage medium. The insets show SEM image of the aligned nanofibers and the TEM image of a single nanofiber, respectively. (c ) Absorption spectrum of the nanocomposite film at different polarization of excitation light. (d ) TPL polarization sensitivity of the sample excited by the corresponding wavelength. Red circles are experimental data of TPL intensities. The blue curve is the fittings with biquadratic cosine functions.
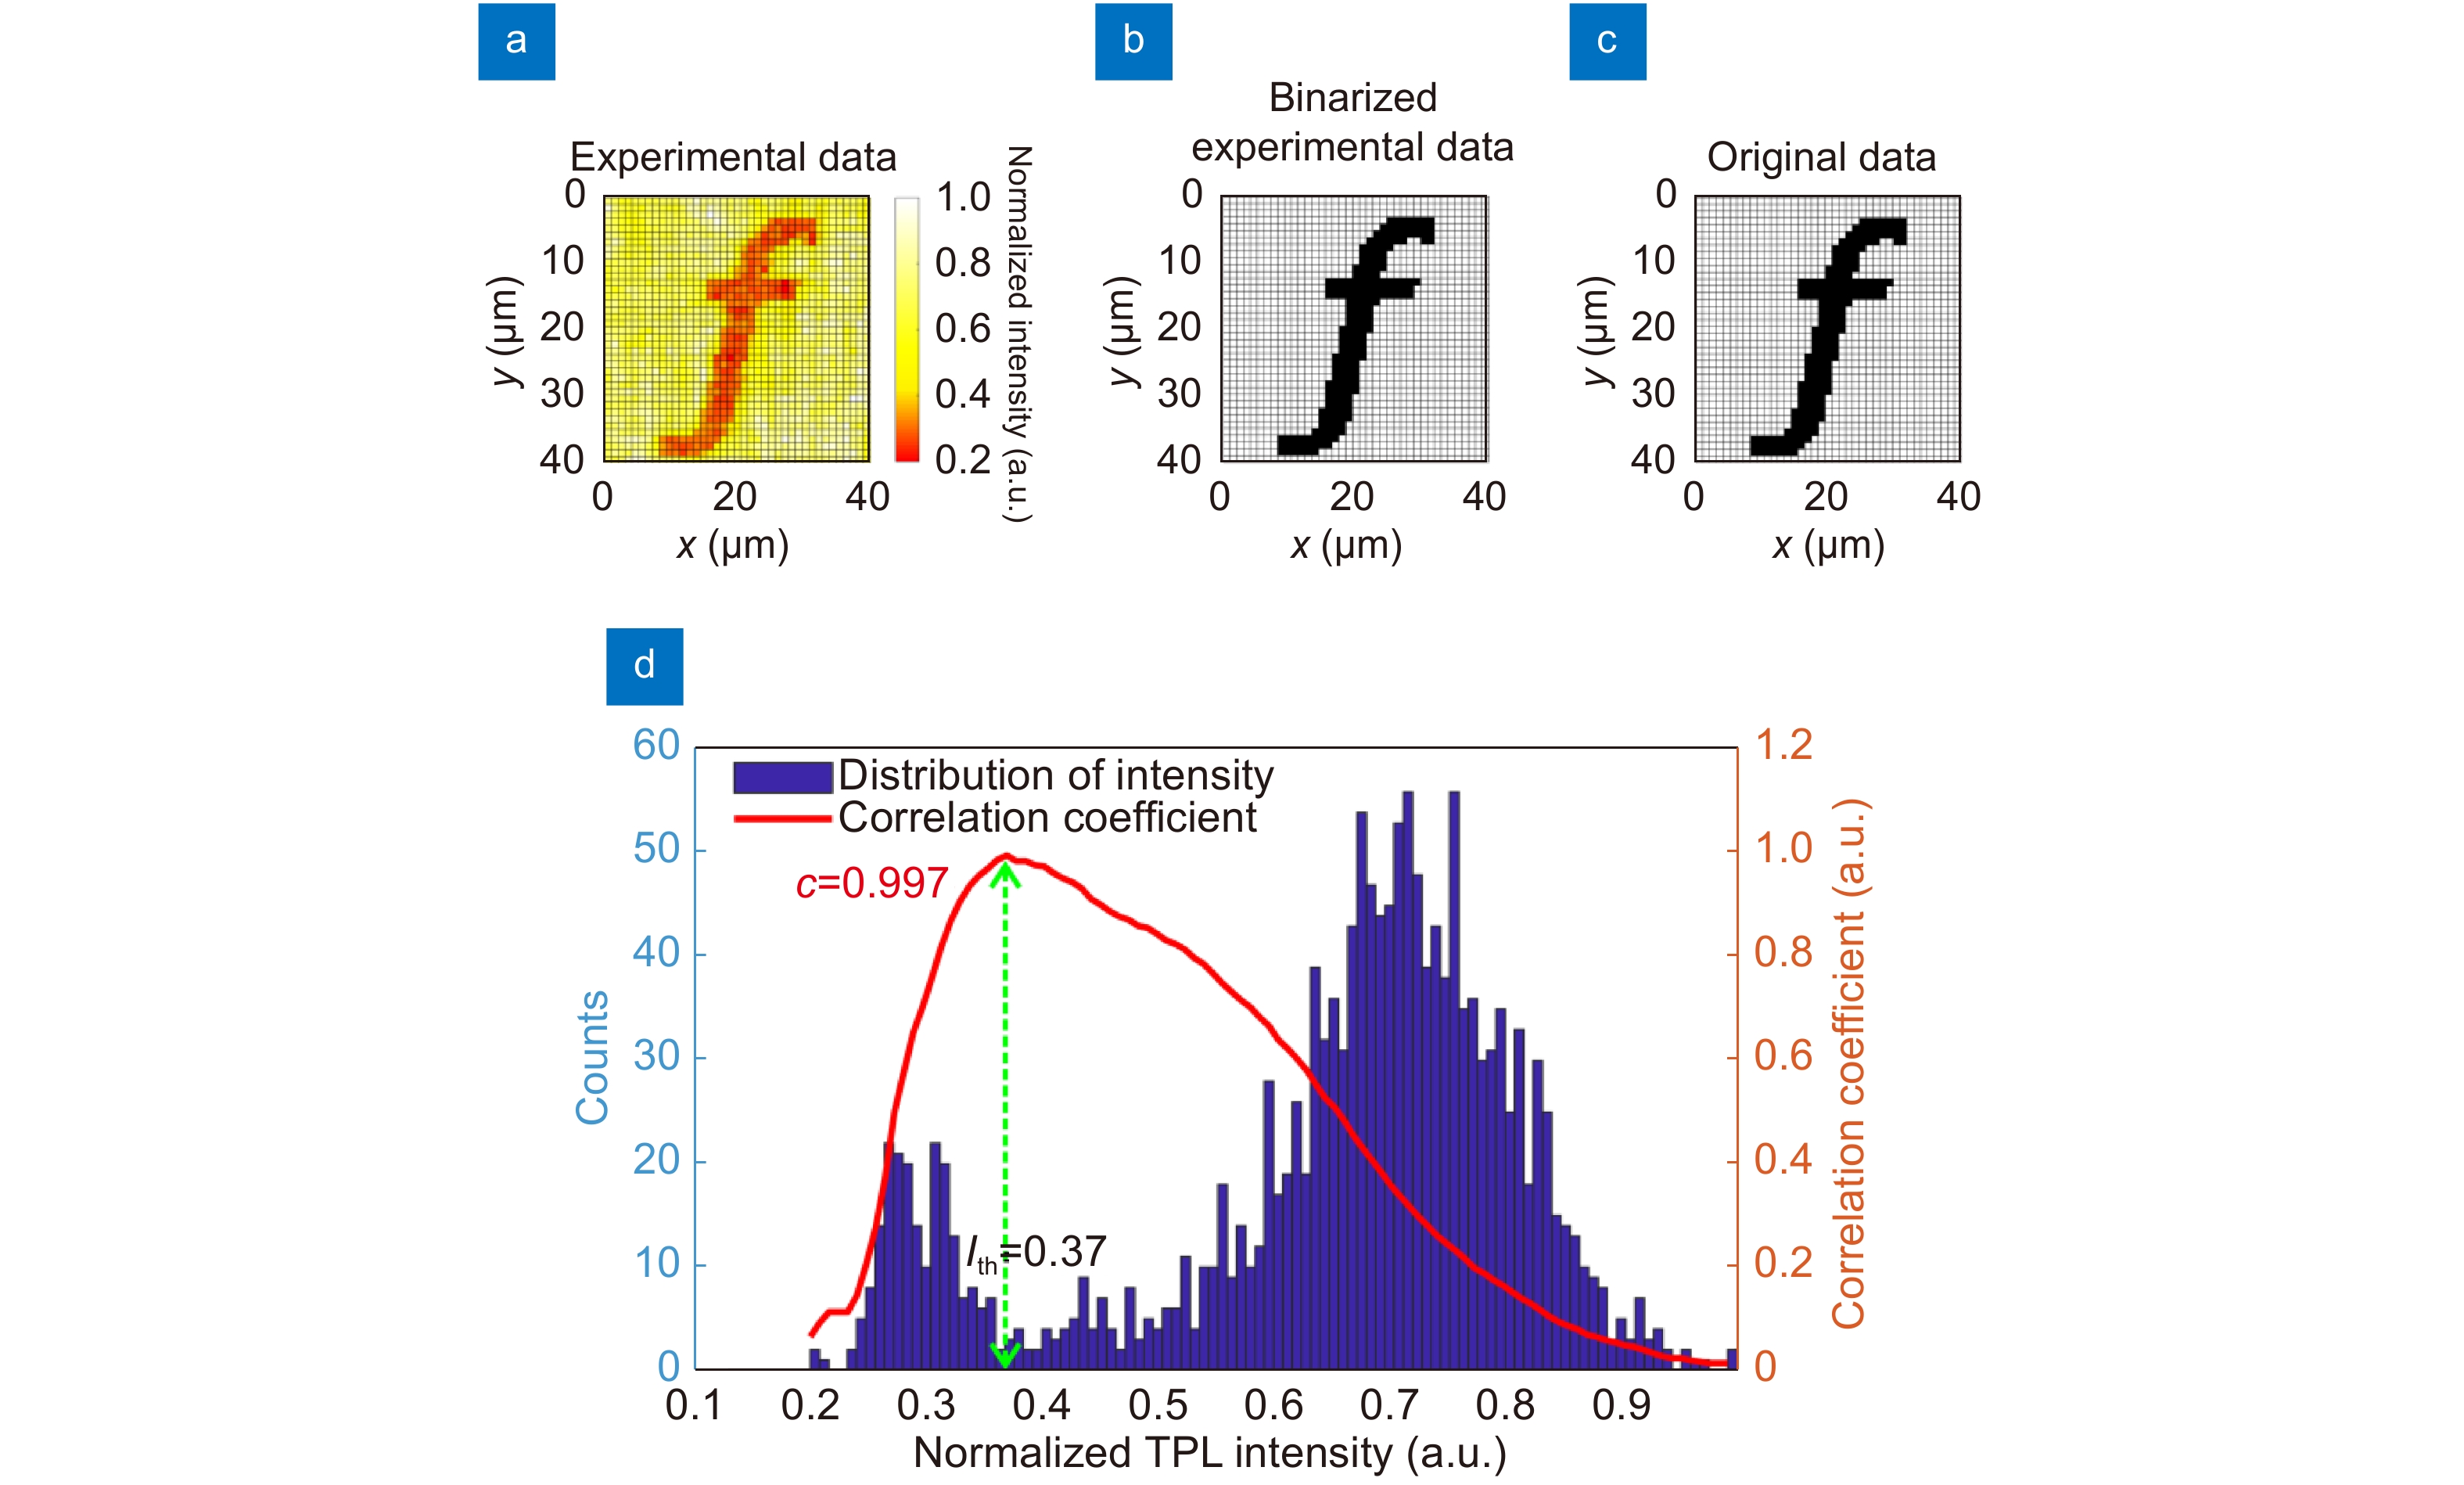
Fig. 2. (a ) The pattern obtained by detecting the TPL intensities of all the information units using polarization 800 nm femtosecond laser beam with the power of 50 μW. The recording powers is 1000 μW. The size of the recording region was 40 × 40 μm with 50 ×50 pixels. (b ) The binarized pattern obtained by choosing an appropriate threshold intensity. (c ) The original pattern used for data recording. (d ) The distribution of the TPL intensities of all the information units in the extracted pattern. The calculated correlation coefficient (c = 0.997) for the extracted pattern is also provided.
Fig. 3. Curves of the correlation coefficient and bit error rate as a function of recording power. Readout results of the TPL signals using 800 nm femtosecond laser beam with the power of 80 μW. The size of the recording region was 40 × 40 μm with 50 × 50 pixels.
Fig. 4. (a ) The optical microscope image of the two-layers data storage medium. (b ) Schematic of the polarized multilayer ODS. (c ) The TPL intensity signal changed as a function of Z scan depths at two polarization angles. (d ) The TPL polarization sensitivity at the corresponding layers. (e ) The retrieved results for the two types of combination with different layers and polarizations are shown in (b). (f ) The statistical charts of the TPL intensities detected from all information units in (e). The calculated correlation coefficients for the extracted pattern are also provided.

Set citation alerts for the article
Please enter your email address
© Copyright 2018-2021 | Chinese Laser Press. All Rights Reserved 沪ICP备15018463号-20