
Linwei Zhu, Yaoyu Cao, Qiuqun Chen, Xu Ouyang, Yi Xu, Zhongliang Hu, Jianrong Qiu, Xiangping Li. Near-perfect fidelity polarization-encoded multilayer optical data storage based on aligned gold nanorods[J]. Opto-Electronic Advances, 2021, 4(11): 210002-1
- Opto-Electronic Advances
- Vol. 4, Issue 11, 210002-1 (2021)
Abstract
Introduction
Optical data storage (ODS) with the merits of large capacity, long lifetime, and low energy consumption is considered as one promising way to tackle the challenge of exponentially increasing amount of information
Among various ODS materials that enable multiplexing optical data recording and reading, plasmonic gold nanorods (GNRs) have exhibited exceptional optical and photothermal properties for storing information in multidimensions
Here, we demonstrate ultra-low crosstalk polarization-encoded ODS technique for high-fidelity data recording and retrieving by utilizing a nanocomposite film involving aligned GNRs. The nanocomposite film is composed of nanofibers which are produced with electrospinning technology
Experiment setup and sample preparation
Experiment setup
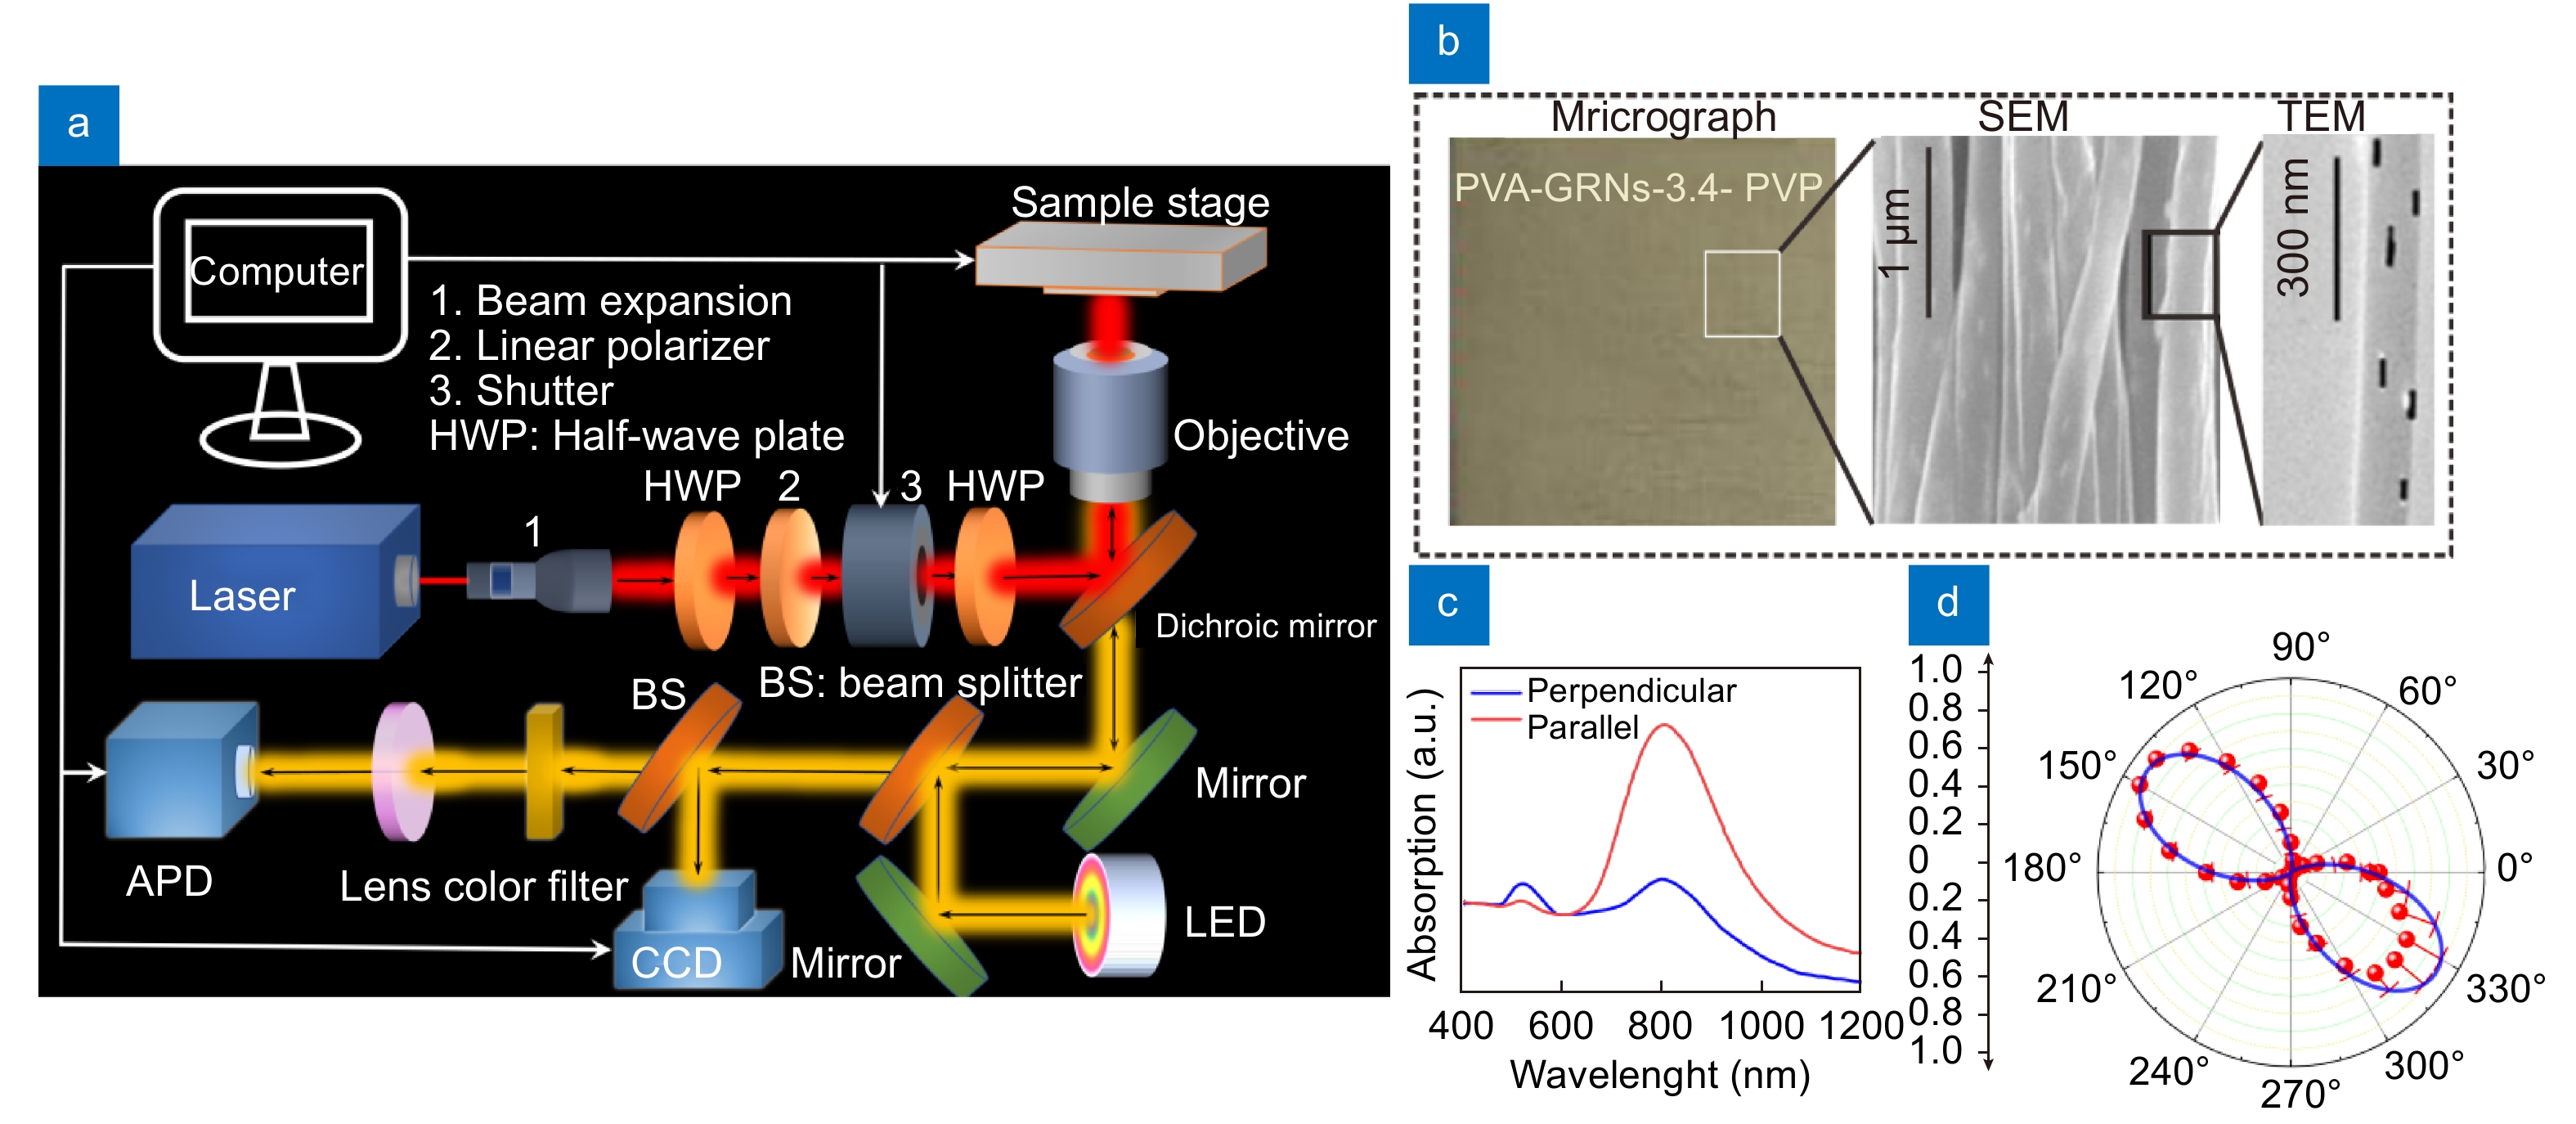
The optical setup for realizing the multilayered ODS is shown in Fig. 1(a). Both recording and readout were conducted in the same home-built optical setup. For reading, a commercial Ti:sapphire oscillator (Chameleon, Coherent), which emits femtosecond (fs) laser pulses with a duration of 140 fs and a repetition rate of 80 MHz, was used as the laser source. The femtosecond laser was initially expanded and collimated for the following recording and readout processes. The combination of the first half-wave plate (HWP) and the linear polarizer was utilized to adjust the laser power. The second HWP placed behind the shutter was used to control the polarization angle relative to the axis of GNRs in the sample. The femtosecond laser was reflected by a dichroic mirror (FF735-Di02-25×36, Semrock) and tightly focused to the sample placed on a three-dimensional stage (P-563.3CD, Physik Instrumente) by an objective (UplanSApo 100×1.40 Oil, Olympus). For readout, the TPL of the sample was excited using low power femtosecond pulses outputted from the same laser. Furthermore, the TPL was collected by the same objective and detected by an avalanche photodiode (APD) (SPCM-AQRH-14-FC, Excelitas Technologies). A short-pass filter was used in front of the APD to filter out the excitation light. To conveniently search the approximate focusing plane of the sample, a LED and a CCD were used, which will be turned off in the recording and readout processes. The home-made software was developed to control the synchronous operation of the shutter, the three-dimensional stage, and the APD acquisition system.
![]()
Figure 1.(
Preparation of the nanocomposite film containing aligned GNRs
The detail for synthesizing the nanocomposite film with aligned GNRs can be found in Supplementary information (the flow diagram is shown in
Fig. S1): Firstly, preparing the GNRs solution, which is the same as the former method
Recording and readout
Both recording and readout were conducted in the same home-built experimental setup. During recording, the femtosecond laser with the central wavelength corresponding to the LSPR absorption peak of the nanocomposite film is utilized. For sufficiently high laser pulse energy, the GNRs inside of the sample will heat up to above the threshold melting temperature and transform their shape into shorter rods or spherical particles
Results and discussion
As an example, a single-layer sample containing aligned GNRs (aspect ratio AR=3.4) was used. The optical microscope image of the sample is shown in Fig. 1(b). From the scanning electron microscope (SEM) image inserted in Fig. 1(b), it is clear to see the collected PVA nanofibers inside of the nanocomposite film exhibits a considerably high degree of alignment. In addition, the longitudinal axis of GNRs is parallel to the aligned axis of PVA nanofibers, as can be seen from the transmission electron microscope (TEM) image. It should be noted that the consistency or the orientation angle of the nanofibers were influenced remarkably by the concentration of the spinning solution, the rotating speed, and the collecting time. The consistency of the GNRs in the nanofibers can reaches above 85% at the proper concentration of the spinning solution, the rotating speed, and the collecting time
In the experiment, we first verify the alignment angles of GNRs obtained from TPL intensity patterns in the scanning microscope image. We retrieve the recordings using LSPR mediated TPL because the nonlinear TPL has a significantly higher angular sensitivity compared with other linear detection methods, such as scattering
Once the alignment angle of GNRs inside of the sample is verified, the polarization orientation of the beam is set parallel to the axis of the aligned GNRs in the recording and readout processes by rotating the second HWP in the experimental setup. The polarization-dependence of the aligned GNRs inside of the sample can effectively reduce crosstalk in both recording and readout processes. In order to confirm the effects of aligned GNRs on the ODS, we use the nanocomposite film involving aligned GNRs of AR=3.4 to record and extract a pattern by using the polarization orientation paralleled to the alignment angle of GNRs. Figure 2(a) shows the readout result of the TPL intensity distribution. The recording area is 40 × 40 μm in size (50 × 50 pixels). It was recorded and read out with the same polarization orientation (the polarization angle shown in Fig. 1(c)) and the central wavelength λ = 800 nm. The recording and readout power are 1000 μW and 50 μW, respectively. Basically, we use the correlation coefficient and bit error rate to characterize the quality of a pattern extracted by detecting the TPL intensities of all the information units. The extracted pattern can be binarized by choosing an appropriate threshold intensity, as shown in Fig. 2(b). The correlation coefficient between the binarized pattern and the original one (shown in Fig. 2(c)) can be defined as follows
where
where
![]()
Figure 2.(
![]()
Figure 3.
For the readout pattern shown in Fig. 2(a), the distribution of the TPL intensities of all the pixels is shown in Fig. 2(d), in which the statistical results of the TPL intensity collected in each pixel show two Gaussian distributions with different average intensities, corresponding to the information units without and with the irradiation of femtosecond laser pulses, respectively. By selecting suitable thresholds for the normalized TPL intensity between the two Gaussian distributions, the two types of information units can be discriminated and binarized. Figure 2(b) shows the binarized pattern at the threshold intensity Ith = 0.37. The correlation coefficient can be deduced by Eq. (1) after the binarization of the readout pattern. We can see that near-perfect fidelity (correlation coefficient c = 0.997) of information storage has been realized. These results demonstrate that it is feasible to record and read out the data information in the nanocomposite nanofibers film, which can be used for ODS with high-quality and low crosstalk (bit error rate e=0.02% calculated by Eq. (2), see Supplementary information in Fig. S4).
Generally, the quality of a recorded pattern characterized by the correlation coefficient can be improved by increasing the recording energy. However, the crosstalk between different recording channels will become larger as the recording energy increase, which results in the reduction of storage capacity and possibly the damage of storage media
Figure 3 shows the correlation coefficient and the bit error rate of different TPL images as a function of recording power. In this example, we use the nanocomposite sample with the LSPR peak at about 800 nm. In both recording and readout, the central wavelength of the femtosecond laser is set as 800 nm. In recording, the laser power changes from 300 μW to 3000 μW. The polarization of the recording laser is parallel to the aligned orientation of the GNRs embedded in the film. In the readout, the power of the laser is 80 μW and remains unchanged in the whole readout process. We choose two polarization orientations to read out the TPL signal, corresponding to parallel and perpendicular to the aligned orientation of the GNRs, respectively. From Fig. 3, we can see that as the recording power increases to 600 μW in the case of the polarization is parallel to the aligned orientation of sample, the correlation coefficient increases sharply and then slowly increase to a certain value when the recording power exceeds 600 μW. This demonstrates the recording power has to reach a threshold to achieve a high correlation coefficient and a low bit error rate. Although the correlation coefficient can be improved by increasing the recording power, the crosstalk will occur, and the correlation coefficient will decrease as the recording power increases.
As shown in Fig. 3, when the polarization of the reading laser is perpendicular to the aligned orientation, the correlation coefficient increases sharply when the recording power is above 1800 μW, meanwhile the bit error rate reduces gradually. That is because the sample is damaged and loses the polarization dependency by using high laser power. When the recording power increases up to a high value, the melting of these GNRs will lead to crosstalk at other polarization angles and decrease the fidelity of extracted information. Hence, high fidelity of information encoding can be realized by choosing a suitable recording power range from 600 μW to 1800 μW.
Furthermore, we demonstrate the multilayer polarization-encoded ODS in Fig. 4. In the experiment, two layers of nanocomposite films with aligned GNRs (PVA-GNRs-3.4-PVP) were prepared by the thermocompression-immersion-drying method. The two orientations of nanofibers inside of the nanocomposite films can be observed in the micrographic image, as shown in Fig. 4(a). Figure 4(b) shows a sketch of the multilayered sample. In this two-layer sample, the spacing and the orientations of aligned GNRs in the two layers can be determined by reading the TPL at various depths and polarizations. Figure 4(c) shows the TPL intensity signal changed as a function of Z scan depth at two polarization angles. The space between the two layers is about 4 μm. To verify the alignment angles of GNRS obtained from their intensity patterns in the TPL scanning images, we performed the TPL polarization sensitivity experiment at the corresponding layer, as shown in Fig. 4(d). It is shown that TPL intensity reaches a maximum when the polarization of the excitation beam is set to 20° and 60° at the corresponding layers, respectively. Therefore, after we confirm the polarization of the recording light, by using different combinations of multilayers and polarizations (i.e., layer 1 and polarization P1, layer 2 and polarization P2), we can realize the polarization-encoded multilayered ODS in the sample with aligned GNRs, as schematically shown in Fig. 4(b). Using the corresponding polarization at each layer, one can retrieve the encoded information in the same spatial region, as shown in Fig. 4(e). The statistical results of the TPL signals under different readout polarizations are also given in Fig. 4(f). The high-quality data storage with near-perfect fidelity (correlation coefficient c> 0.99) was realized in the multilayers. As can be seen from these results, very small crosstalk among different polarization channels was observed (bit error ratee≈0.1%, see Supplementary information in Fig. S5), validating the possibility of realizing polarization-encoded multilayers ODS with near-perfect fidelity utilizing the materials of the aligned GNRS. It should be pointed out that there are still some bit errors in the readout process, which can be attributed to the inhomogeneity of the sample. For the inhomogeneity of the sample, it may be due to the low doping concentration of GNRs in the single-layer sample, or the distribution of GNRs is not uniform. Another possible reason may be the GNR orientation in nanofibers is not uniform. Besides, the nonuniformity of the PVP during the filling process can also lead to bit errors in the data readout. Thus, further improvement in the preparation process of the nanocomposite film is the key to realize the aligned GNRs successfully for information storage in practice.. By contrast, the fidelity of data encoding in the ODS medium with randomly aligned GNRs is less than that in the material of aligned GRNs, and the bit error rate readout from disorder GNRs is more than ten times higher as that from aligned GNRs (shown in Fig. S6 of Supplementary information).
![]()
Figure 4.(
In addition, compared with the randomly aligned GNRs for polarization-encoded multilayered ODS, the prepared nanocomposite film composed of aligned GNRs will be highly beneficial in reducing optical losses and efficiently delivering beam energy down to bottom layers. A significant improvement in the transmitted recording beam intensity by multilayers containing aligned GNRs can be achieved at all layers (shown in Fig. S7 of Supplementary information). Therefore, this property of polarization-encoded TPL readout in progressively twisted aligned GNRs arrays through the multilayers can further reduce the loss in multilayer ODS and simultaneously maintain near-perfect fidelity for encoding information, which is previously impossible with randomly aligned GNRs.
Conclusions
In summary, we have presented an electrospinning technology to prepare ODS recording media composed of a nanocomposite film doped with aligned GNRs. We achieved experimentally multilayers ODS with near-perfect fidelity and low bit error rate by utilizing the nanocomposite film supporting both polarization and multi-dimension data encoding. We have developed a correlation coefficient and a bit error rate to characterize the quality of a recorded pattern. Using this parameter, we can determine the optimum recording laser power. Such polarization-encoded and multilayer ODS is enabled by choosing a suitable recording and readout laser powers to digitize the TPL collected from the focus spot. This demonstrates the validity of the polarization detuning method for mitigating crosstalk through multilayer ODS. The combination of polarization-encoded ODS and multiplexing among different physical dimensions substantially increases the degrees of freedom for manipulating light-matter interactions and paves the way for the realization of green and high fidelity ODS
References
[1] High-capacity optical long data memory based on enhanced Young's modulus in nanoplasmonic hybrid glass composites. Nat Commun, 9, 1183(2018).
[2] Nanomaterials for optical data storage. Nat Rev Mater, 1, 16070(2016).
[3] High-security-level multi-dimensional optical storage medium: nanostructured glass embedded with LiGa5O8: Mn2+ with photostimulated luminescence. Light: Sci Appl, 9, 22(2020).
[4] Optical storage arrays: a perspective for future big data storage. Light:Sci Appl, 3, e177(2014).
[5] Collinear holographic data storage technologies. Opto‐Electron Adv, 3, 190004(2020).
[6] Superresolution-focal-volume induced 3.0 Tbytes/disk capacity by focusing a radially polarized beam. Opt Lett, 36, 2510-2512(2011).
[7] Super-resolved pure-transverse focal fields with an enhanced energy density through focus of an azimuthally polarized first-order vortex beam. Opt Lett, 39, 5961-5964(2014).
[8] Three-dimensional deep sub-diffraction optical beam lithography with 9 nm feature size. Nat Commun, 4, 2061(2013).
[9] Biomimetic gyroid nanostructures exceeding their natural origins. Sci Adv, 2, e1600084(2016).
[10] Multifocal optical nanoscopy for big data recording at 30 TB capacity and gigabits/second data rate. Optica, 2, 567-570(2015).
[11] Pushing the limits of optical information storage using deep learning. Nat Nanotechnol, 14, 237-244(2019).
[12] Optical data storage and multicolor emission readout on flexible films using deep-trap persistent luminescence materials. Adv Funct Mater, 28, 1705769(2018).
[13] Polarization-multiplexed encoding at nanometer scales. Opt Express, 22, 26240-26245(2014).
[14] Two-photon-induced polarization-multiplexed and multilevel storage in photoisomeric copolymer film. Opt Lett, 35, 46-48(2010).
[15] Electron-beam lithography of plasmonic nanorod arrays for multilayered optical storage. Opt Express, 22, 13234-13243(2014).
[16] Polychromatic and polarized multilevel optical data storage. Nanoscale, 11, 2447-2452(2019).
[17] Phase angle encoded upconversion luminescent nanocrystals for multiplexing applications. Nanoscale, 9, 1676-1686(2017).
[18] Deep-subwavelength resolving and manipulating of hidden chirality in achiral nanostructures. ACS Nano, 12, 3908-3916(2018).
[19] Reveal and control of chiral cathodoluminescence at subnanoscale. Nano Lett, 18, 567-572(2018).
[20] Five-dimensional optical recording mediated by surface plasmons in gold nanorods. Nature, 459, 410-413(2009).
[21] Two-stage optical recording: photoinduced birefringence and surface-mediated bits storage in bisazo-containing copolymers towards ultrahigh data memory. Opt Express, 24, 23557-23565(2016).
[22] Femtosecond laser induced surface deformation in multi-dimensional data storage. Appl Phys Lett, 101, 251116(2012).
[23] Manipulation of multidimensional plasmonic spectra for information storage. Appl Phys Lett, 98, 171106(2011).
[24] Hot luminescence from gold nanoflowers and its application in high-density optical data storage. Opt Express, 25, 9262-9275(2017).
[25] Tailoring multidimensional traps for rewritable multilevel optical data storage. ACS Appl Mater Interfaces, 11, 35023-35029(2019).
[26] Omnidirectional iridescence via cylindrically-polarized femtosecond laser processing. Opto-Electron Adv, 3, 190035(2020).
[27] Three-dimensional orientation-unlimited polarization encryption by a single optically configured vectorial beam. Nat Commun, 3, 998(2012).
[28] Encoding random hot spots of a volume gold nanorod assembly for ultralow energy memory. Adv Mater, 29, 1701918(2017).
[29] Manipulating light-matter interaction in a gold nanorod assembly by plasmonic coupling. Laser Photonics Rev, 10, 826-834(2016).
[30] Simultaneously strong and tough ultrafine continuous nanofibers. ACS Nano, 7, 3324-3331(2013).
[31] Nanofibers of conjugated polymers prepared by electrospinning with a two-capillary spinneret. Adv Mater, 16, 2062-2066(2004).
[32] Seeded growth of monodisperse gold nanorods using bromide-free surfactant mixtures. Nano Lett, 13, 2163-2171(2013).
[33] Ultrafast nonlinear optical response of a single gold nanorod near its surface plasmon resonance. Phys Rev Lett, 107, 057402(2011).
[34] Laser-induced shape changes of colloidal gold nanorods using femtosecond and nanosecond laser pulses. J Phys Chem B, 104, 6152-6163(2000).
[35] Flexible and transparent optically anisotropic films based on oriented assembly of nanofibers. J Mater Chem C, 4, 1029-1038(2016).
[36] Spectrally coded optical data storage by metal nanoparticles. Opt Lett, 25, 563-565(2000).
[37] Optical control and patterning of gold-nanorod-poly(vinyl alcohol) nanocomposite films. Adv Funct Mater, 15, 1065-1071(2005).
[38] Spectral encoding on gold nanorods doped in a silica sol–gel matrix and its application to high-density optical data storage. Adv Funct Mater, 17, 875-880(2007).
[39]
[40] Effect of heat accumulation on the dynamic range of a gold nanorod doped polymer nanocomposite for optical laser writing and patterning. Opt Express, 15, 12151-12160(2007).
[41] Synthetic helical dichroism for six-dimensional optical orbital angular momentum multiplexing. Nature Photonics(2021).

Set citation alerts for the article
Please enter your email address
© Copyright 2018-2021 | Chinese Laser Press. All Rights Reserved 沪ICP备15018463号-20