
Changjian Zhang, Chengyun Zhang, Zhenglong Zhang, Tao He, Xiaohu Mi, Ting Kong, Zhengkun Fu, Hairong Zheng, Hongxing Xu. Self-suspended rare-earth doped up-conversion luminescent waveguide: propagating and directional radiation[J]. Opto-Electronic Advances, 2020, 3(6): 190045-1
- Opto-Electronic Advances
- Vol. 3, Issue 6, 190045-1 (2020)
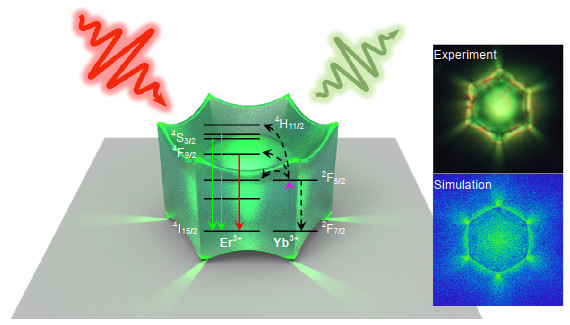
Fig. 1. Schematic of the directional UC emission of crown-shaped NaYF4:Yb3+/Er3+ under an excitation of 980 nm and the experimental and simulated UC luminescent patterns.
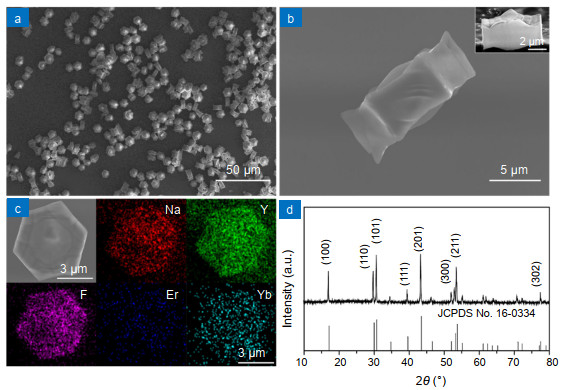
Fig. 2. (a–b) SEM images of NaYF4:Yb3+/Er3+ microparticles, the cross-section of single microparticle shown in the inset image in (b). (c) Element mapping of a single NaYF4:Yb3+/Er3+ microparticle. (d) XRD pattern of the particles and standard pattern of the hexagonal phases of NaYF4.
Fig. 3. (a–b) UC fluorescence patterns and spectra obtained through change excitation position from the center to corner/edge. (c) Energy-level diagram and possible transitions/emission schemes of Yb3+ and Er3+.
Fig. 4. (a–e) UC luminescence patterns of total (a) , green (b) , and red (c) emissions, the simulation pattern (d) , and possible propagation/emission mode (e) of single NaYF4:Yb3+/Er3+ under excited conditions on the middle. (f–j) UC luminescence patterns of total (f) , green (g) , and red (h) emissions, the simulation pattern (i) , and possible propagation/emission modes (j) of single NaYF4:Yb3+/Er3+ under off-centered excitation.
Fig. 5. The directional emission of the luminescent waveguide with center (a–d) and off-center excitations (upward offset, e–h, and downward offset, i–l).(a, e, i) optical pattern on the image plane, in which the excitation and collection positions were marked with red and white circles, (b, f, g) experimental and (c, g, k) simulated Fourier images of the selected region, and (d, h, i) the angular intensity distribution of radiation on the Fourier plane taken along the direction, where θ has maximum intensity. The insert images show the φ distributions on the Fourier plane.

Set citation alerts for the article
Please enter your email address
© Copyright 2018-2021 | Chinese Laser Press. All Rights Reserved 沪ICP备15018463号-20