
Chuan Qiao, Yalin Ding, Yongsen Xu, Yuan Yao, Hao Wang. Image Registration Method Based on Geo-Location Information and Precision Analysis[J]. Acta Optica Sinica, 2017, 37(8): 0828001
- Acta Optica Sinica
- Vol. 37, Issue 8, 0828001 (2017)
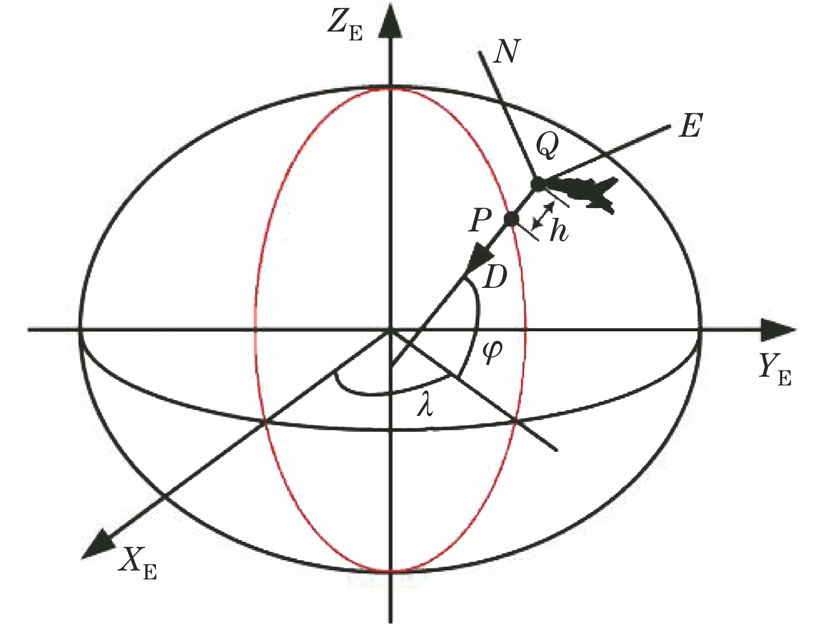
Fig. 1. Schematic of ECEF coordinate and NED coordinate
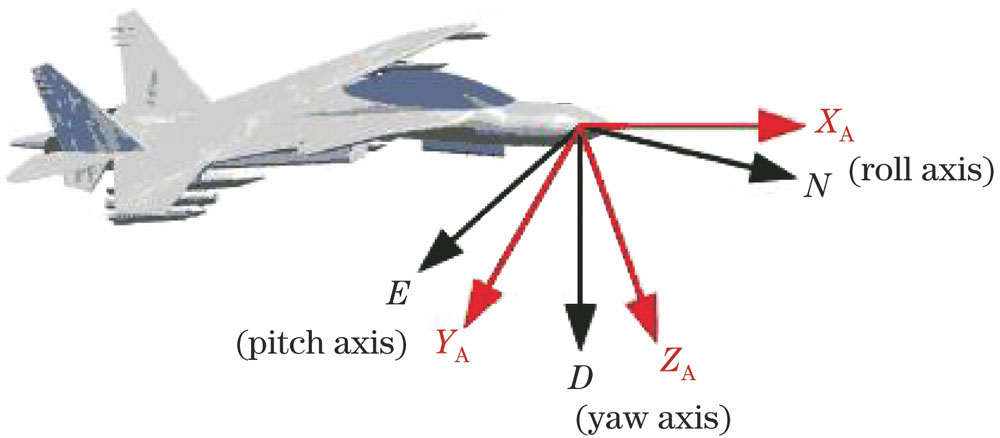
Fig. 2. Schematic of NED coordinate and AC coordinate
Fig. 3. Diagram of aerial camera
Fig. 4. Schematic of aerial camera coordinate
Fig. 5. Schematic of matching point projecting on CCD
Fig. 6. Shooting area of aerial remote sensing image
Fig. 7. Diagram of aerial remote sensing image registration
Fig. 8. Flow chart of selecting matching point
Fig. 9. Distribution of geo-location point and its error probability. (a) Distribution of geo-location point; (b) distribution of latitude error probability; (c) distribution of longitude error probability
Fig. 10. Circular error probability of geo-location with different gimbal roll angles
Fig. 11. Distribution of matching point projecting on CCD. (a) The first image; (b) the second image
Fig. 12. Relative distribution of matching point projecting on CCD in two aerial remote sensing images
Fig. 13. Registration results of ground scenery image
Fig. 14. Registration results of two ocean aerial remote sensing images
| ||||||||||||||||||||||||||||||||||
Table 1. Data in geo-location simulation program
| ||||||||||||||||||||||||||||||||||||||||||||||||||||||
Table 2. Data in image registration simulation experiment
| ||||||||||||||||||||||||||||||||||
Table 3. Comparison of the registration results with the Google Earth
| |||||||||||||||||||||||||||||||||||||||||||||||
Table 4. Geo-location and registration results of two ocean aerial remote sensing images

Set citation alerts for the article
Please enter your email address
© Copyright 2018-2021 | Chinese Laser Press. All Rights Reserved 沪ICP备15018463号-20