
Mengyu Xing, Xiaomin Guo, Haojie Zhang, Jianchao Zhang, Yanqiang Guo. Precisely Reconstructing Phase Space Distribution of Different Chaotic Lasers Using Maximum Likelihood Method[J]. Chinese Journal of Lasers, 2023, 50(6): 0612002
- Chinese Journal of Lasers
- Vol. 50, Issue 6, 0612002 (2023)
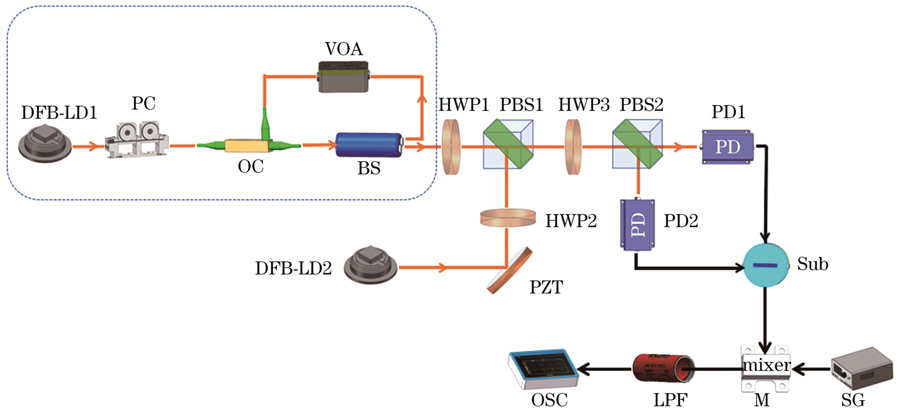
Fig. 1. Schematic of experimental setup for precisely reconstructing Wigner quasi-probability distribution of chaotic lasers through maximum likelihood method
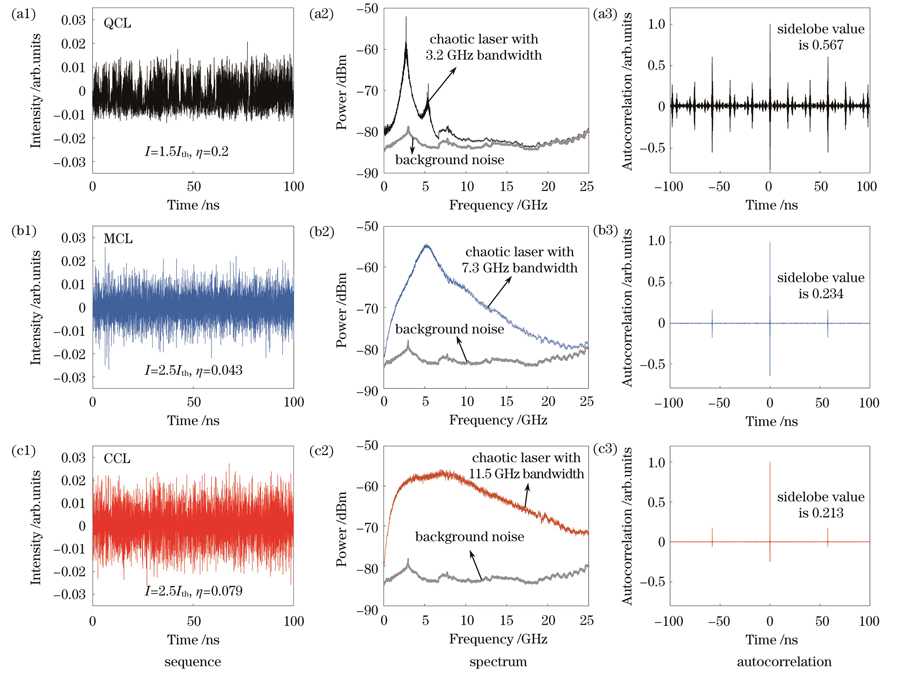
Fig. 2. Sequence, spectrum and autocorrelation diagrams of chaotic lasers measured under different
Fig. 3. Measured fluctuation results of quadrature components between chaotic lasers in different states and shot noise limits in vacuum state. (a) QCL with 3.2 GHz bandwidth ; (b) MCL with 7.3 GHz bandwidth ; (c) CCL with 11.5 GHz bandwidth
Fig. 4. Experimental reconstruction results of chaotic laser. (a1)-(a3) QCL with 3.2 GHz bandwidth; (b1)-(b3) MCL with 7.3 GHz bandwidth; (c1)-(c3) CCL with 11.5 GHz bandwidth
Fig. 5. Reconstructed diagonal element distributions of density matrixes before and after removing background noise.(a1)-(b1)QCL with 3.2 GHz bandwidth;(a2)-(b2)MCL with 7.3 GHz bandwidth;(a3)-(b3)CCL with 11.5 GHz bandwidth
Fig. 6. Fidelity of Wigner quasi-probability distribution versus mean photon number for QCL,MCL,and CCL before and after considering system loss and background noise.(a)Before considering system loss and background noise;(b)after considering system loss and background noise
|
Table 1. Measured diagonal elements of density matrixes for QCL, MCL,and CCL
|
Table 2. Measured diagonal elements of density matrixes for QCL, MCL,and CCL after removing background noise

Set citation alerts for the article
Please enter your email address
© Copyright 2018-2021 | Chinese Laser Press. All Rights Reserved 沪ICP备15018463号-20