
Peng Wan, Cuihong Yang. Properties of Graphene TE Mode Surface Plasmons and Surface Plasmon Waveguides[J]. Acta Optica Sinica, 2017, 37(11): 1124002
- Acta Optica Sinica
- Vol. 37, Issue 11, 1124002 (2017)
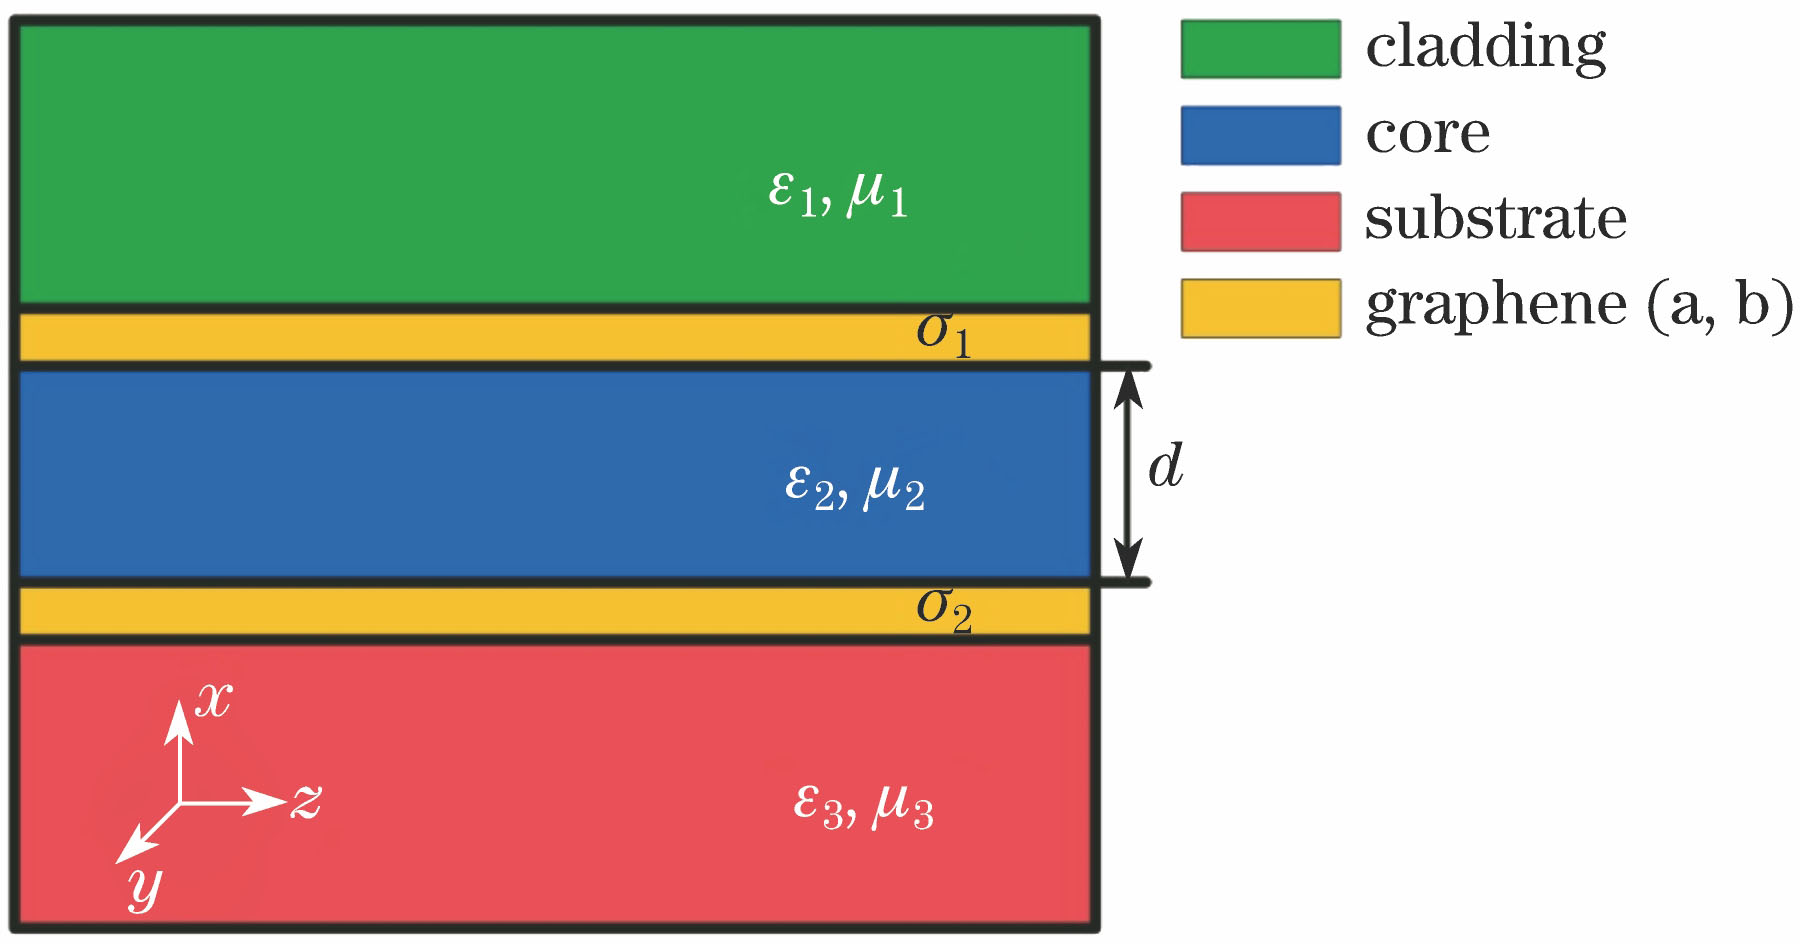
Fig. 1. Slab structure of graphene
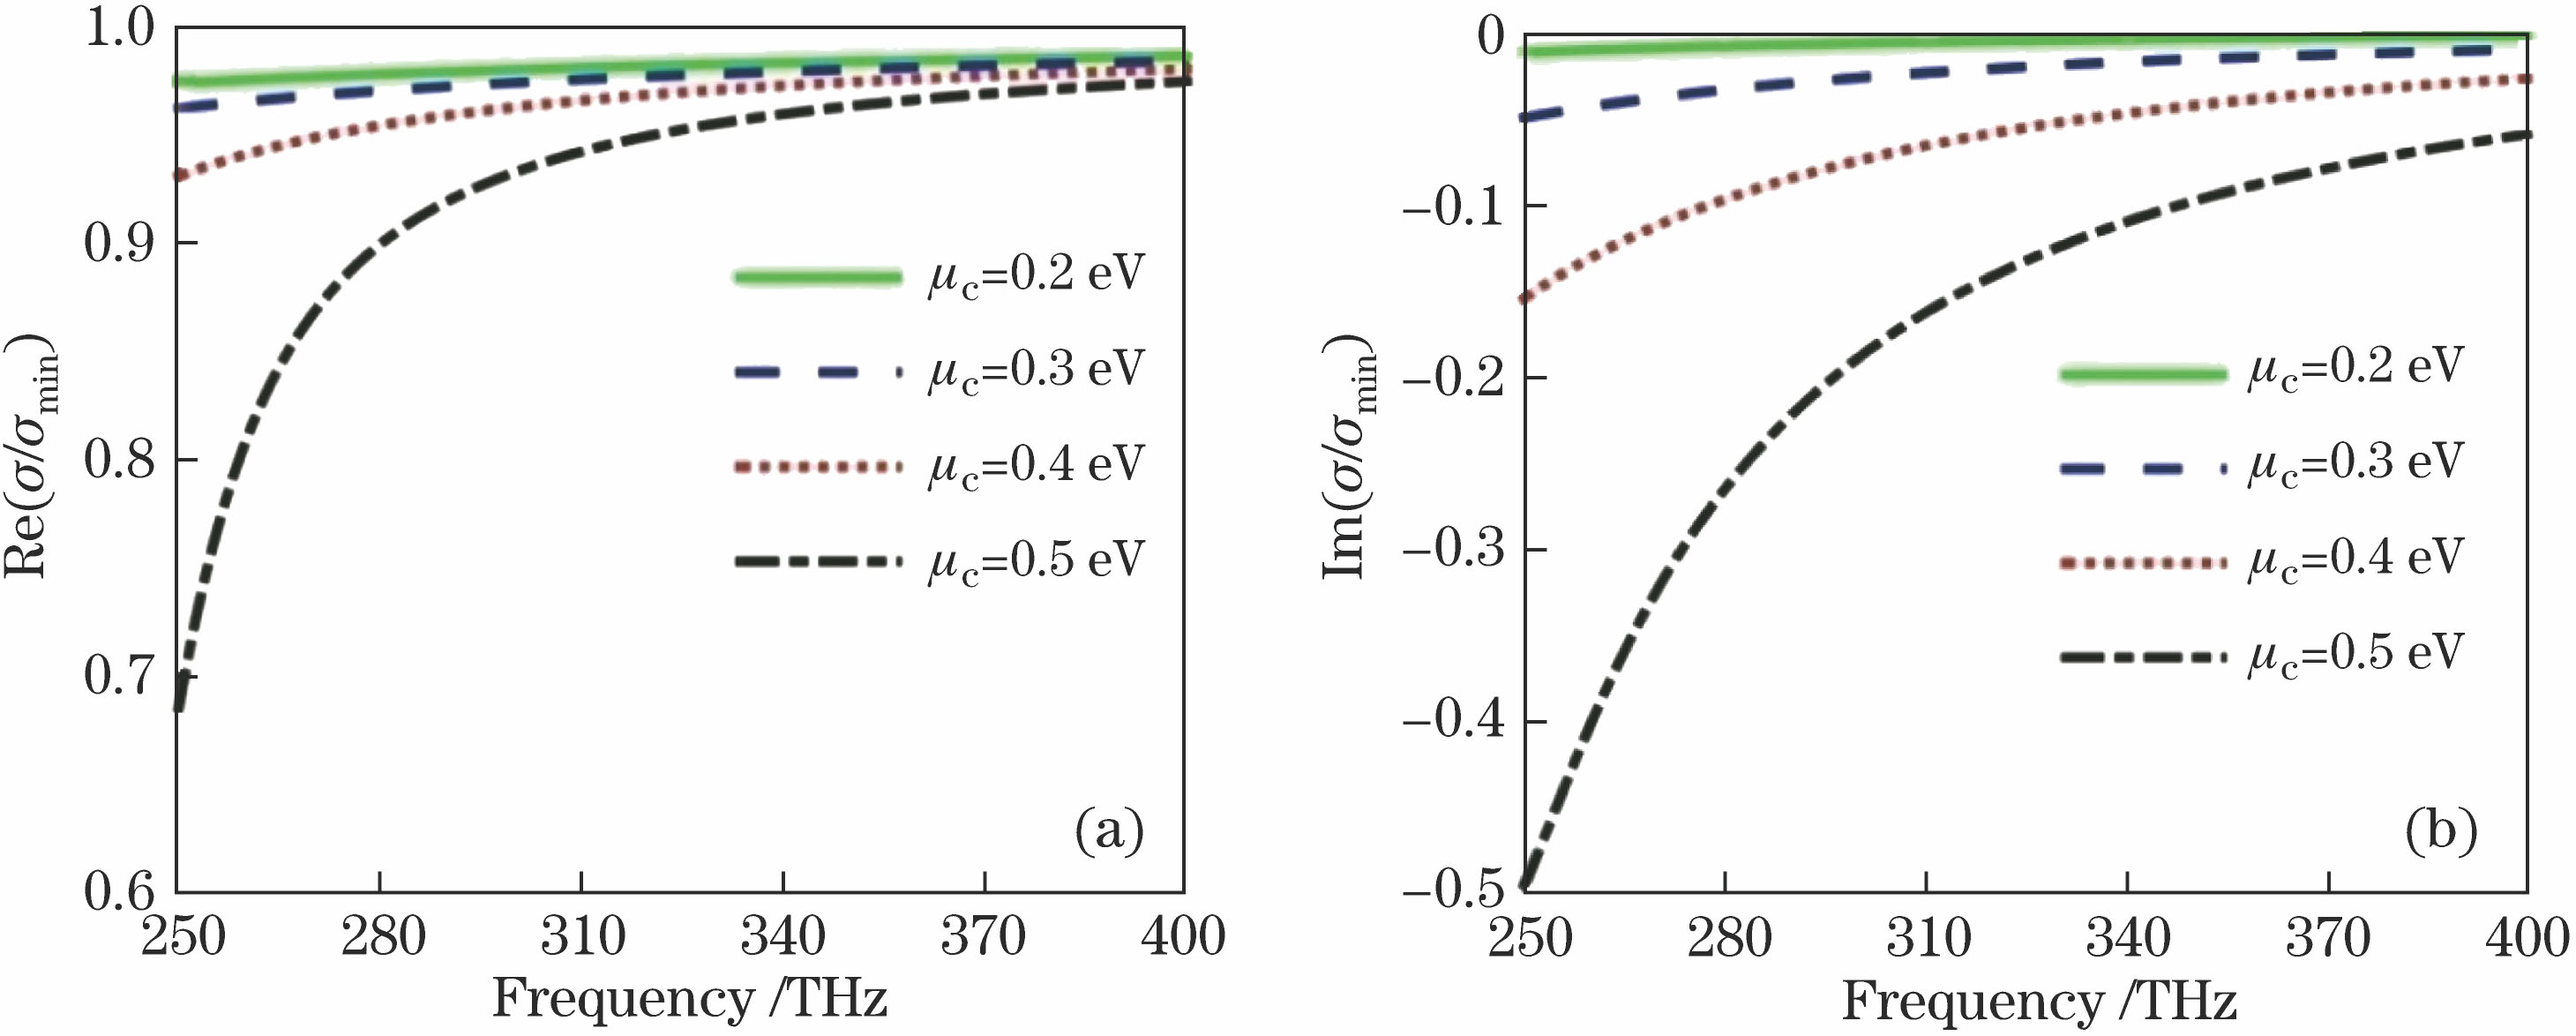
Fig. 2. Change of graphene conductivity with frequency at different chemical potentials. (a) Real part; (b) imaginary part
Fig. 3. Dispersion of TE mode in a suspended graphene structure varies with frequency at different chemical potentials. (a) Effective refractive index neff; (b) Im(β/k0)
Fig. 4. Dispersion of TE mode varies with frequency in a two-layer dielectric structure as ε1=ε2 (the refractive indices of Si, SiC and SiO2 are 3.67, 2.57 and 1.53, respectively; μc=0.5 eV). (a) neff; (b) Im(β/k0)
Fig. 5. Dispersion of TE mode varies with frequency as ε1≈ε2 [ε1(SiO2)=2.3409; ε2(SiO2) are 2.3409, 2.3410, 2.3411, and 2.3412, respectively; μc=0.5 eV]. (a) neff; (b) Im(β/k0)
Fig. 6. Dispersion of TE mode varies with frequency in the waveguide with and without graphene in the interfaces a and b (n3=1.460, μc=0.5 eV). (a) neff; (b) Im(β/k0)
Fig. 7. Dispersion of TE mode varies with frequency for different dielectric constant n3 in substrate waveguide with and without graphene in the interface b (μc=0.5 eV). (a) neff; (b) Im(β/k0)
Fig. 8. Dispersion of TE mode varies with frequency at different chemical potentials of graphene in the interface b [μc(a)=0.2 eV, n3=1.460]. (a) neff; (b) Im(β/k0)

Set citation alerts for the article
Please enter your email address
© Copyright 2018-2021 | Chinese Laser Press. All Rights Reserved 沪ICP备15018463号-20