• Laser & Optoelectronics Progress
  • Vol. 56, Issue 15, 151701 (2019)
Yu Yang1, Zhengrong Tao1, Jing Yan2, Shuxing Lü1, Ran Wang1, Xiaodan Liu1, and Xuguo Sun1、*
Author Affiliations
  • 1 School of Medical Laboratory, Tianjin Medical University, Tianjin 300203, China
  • 2 School of Computer Science and Engineering, Tianjin University of Technology, Tianjin 300384, China
  • show less
    DOI: 10.3788/LOP56.151701 Cite this Article Set citation alerts
    Yu Yang, Zhengrong Tao, Jing Yan, Shuxing Lü, Ran Wang, Xiaodan Liu, Xuguo Sun. Raman Shift Characteristics of Substance Expression and Accumulation Structure in Lung Cancer Cells[J]. Laser & Optoelectronics Progress, 2019, 56(15): 151701 Copy Citation Text show less
    Trends in cell culture days and cell viability
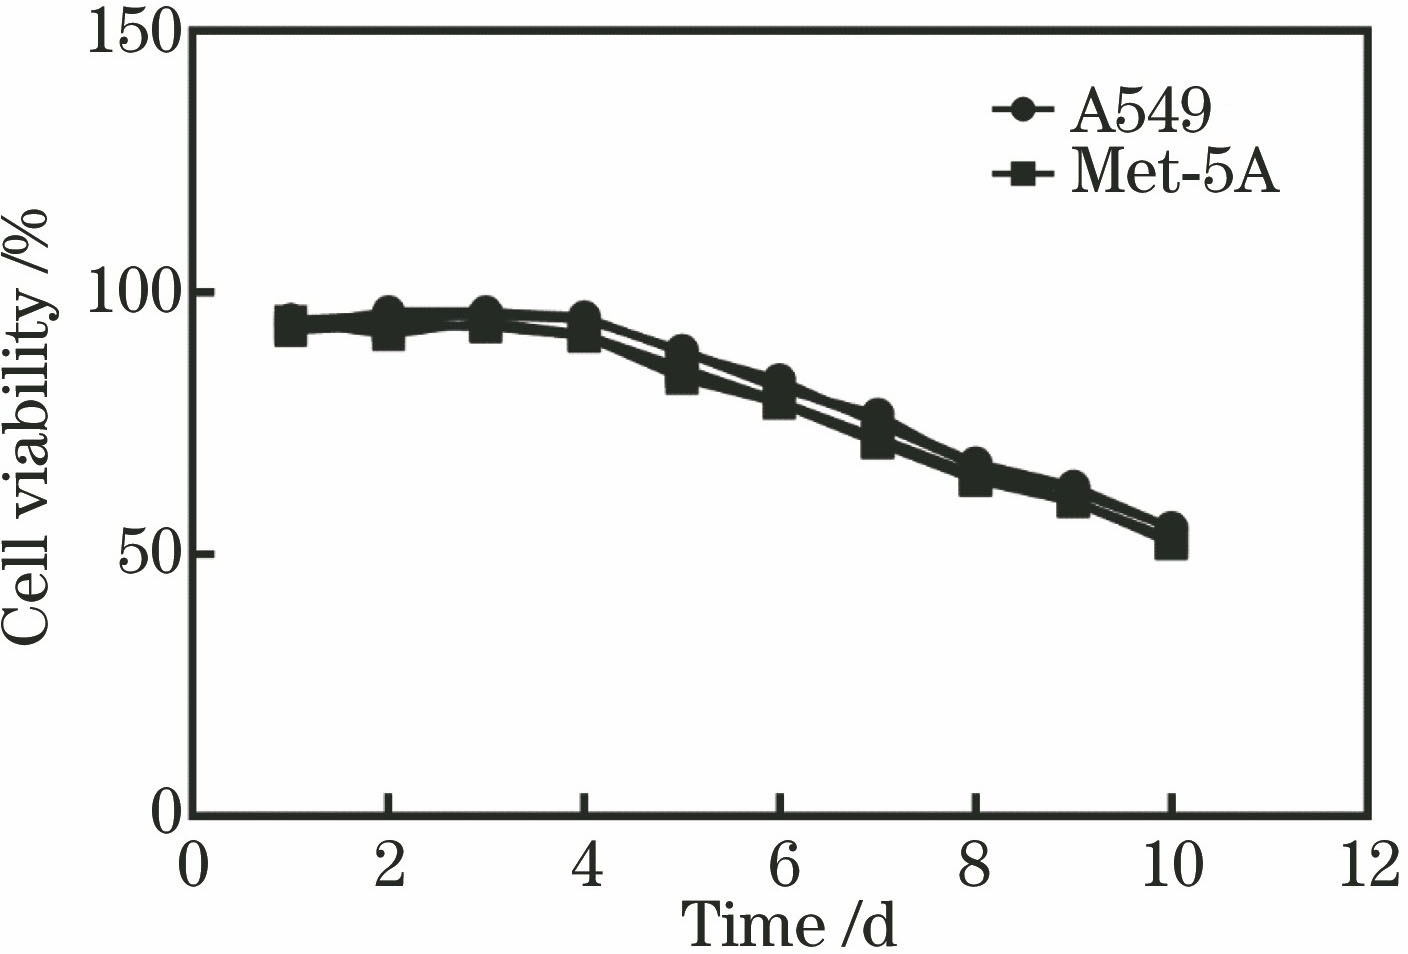
    Fig. 1. Trends in cell culture days and cell viability
    Morphological characteristics of A549 and Met-5A cells in optical microscopy with extension of culture time. (a) A549; (b) Met-5A
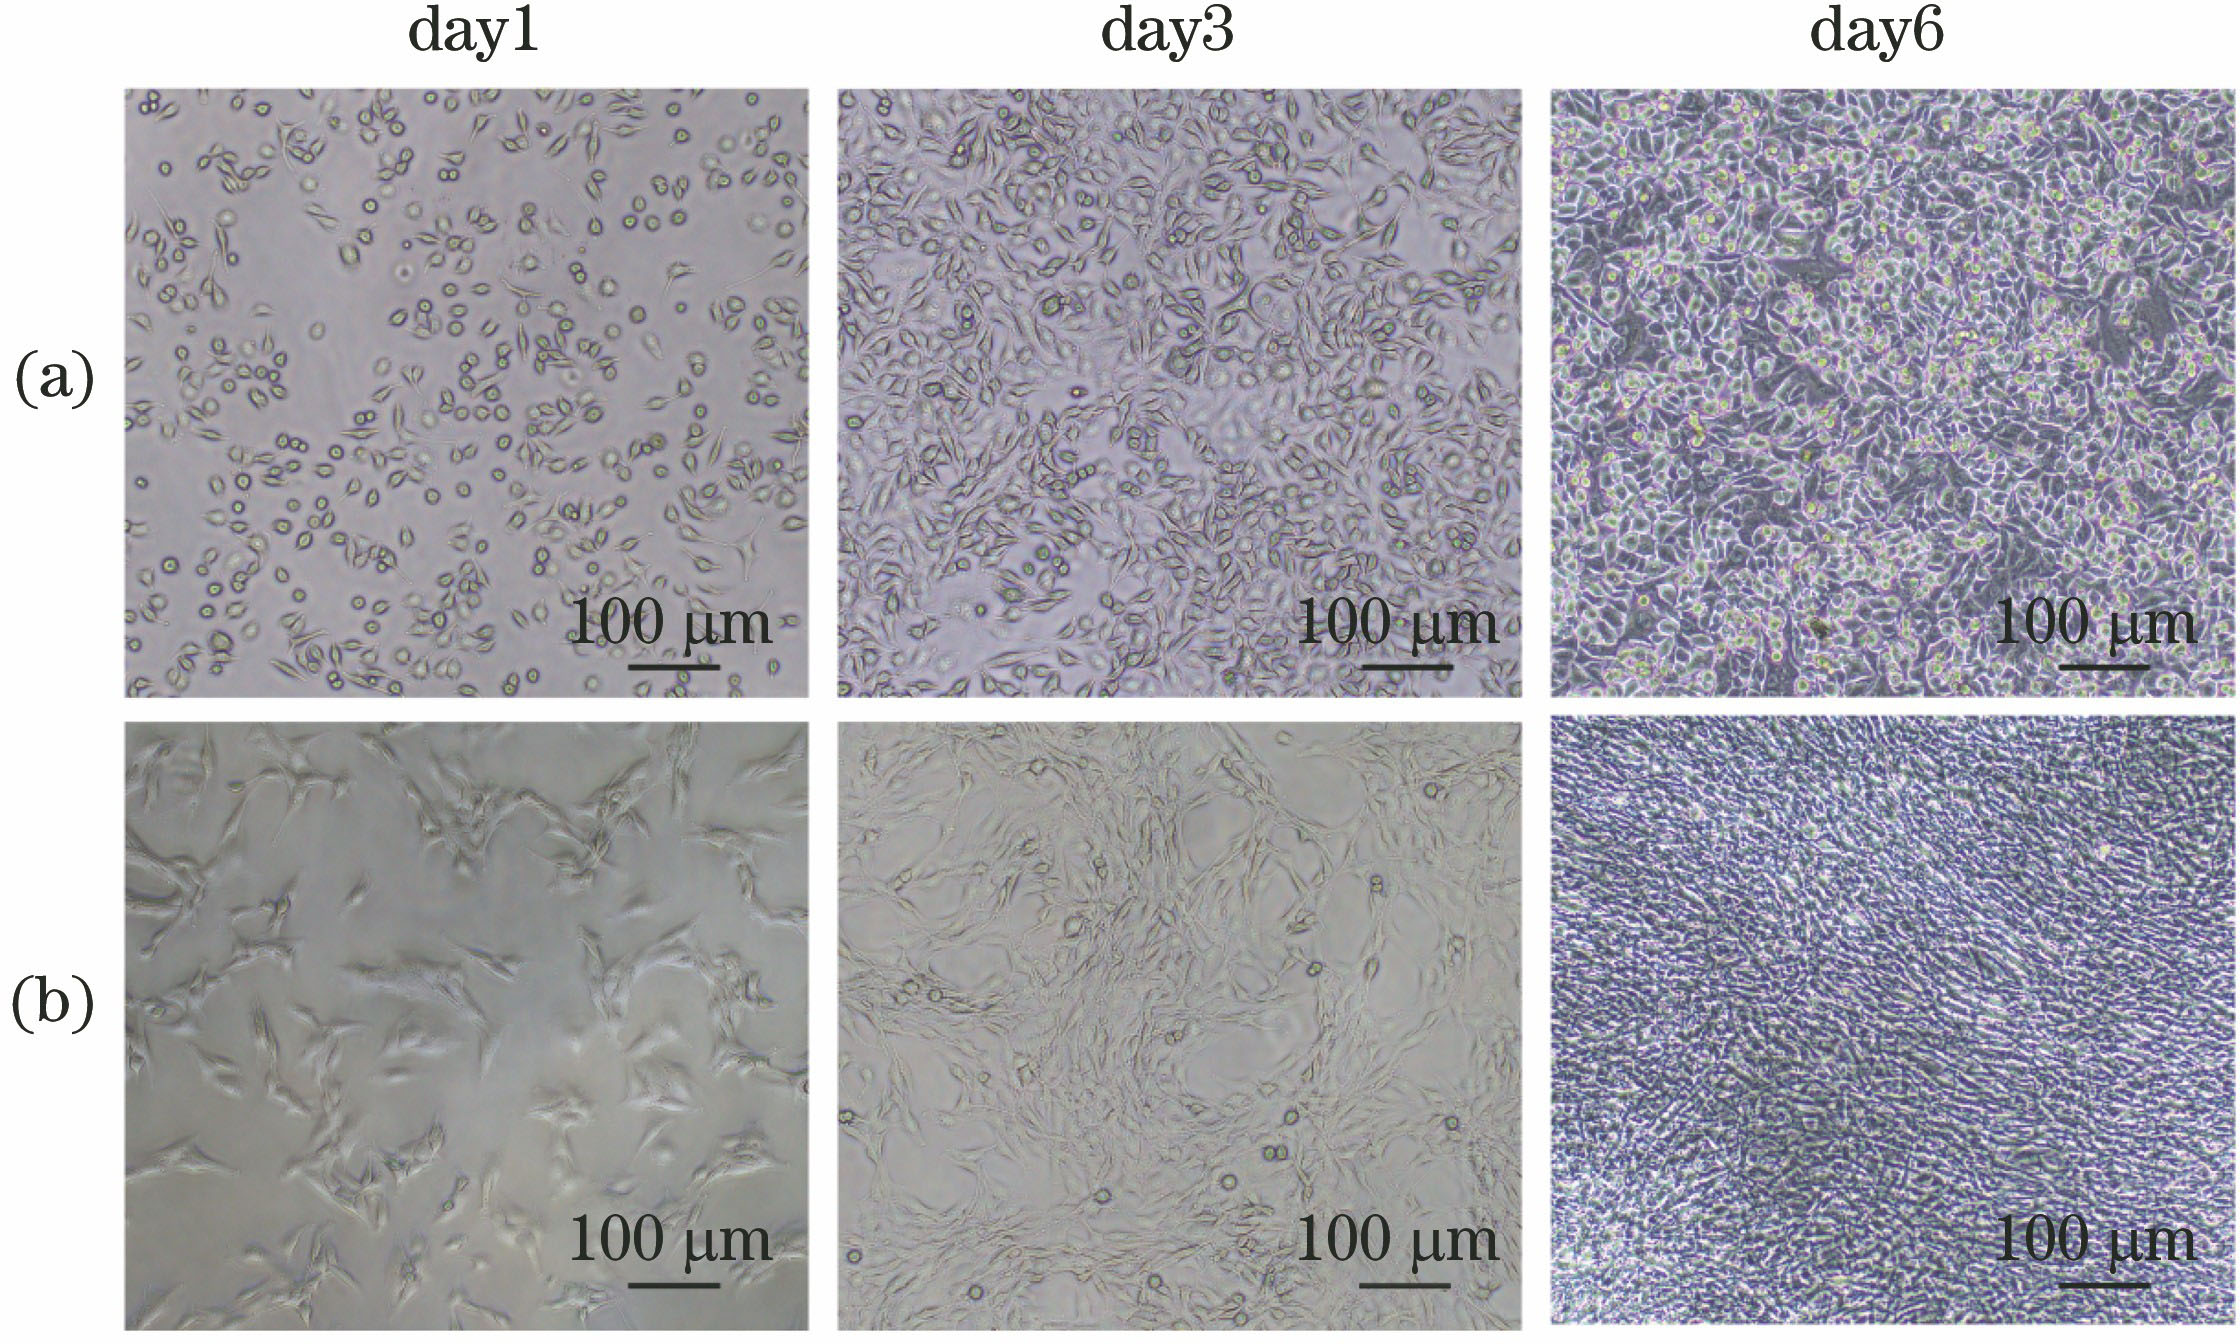
    Fig. 2. Morphological characteristics of A549 and Met-5A cells in optical microscopy with extension of culture time. (a) A549; (b) Met-5A
    Optical images of A549 and Met-5A cells under Raman instruments. (a) A549; (b) Met-5A
    Fig. 3. Optical images of A549 and Met-5A cells under Raman instruments. (a) A549; (b) Met-5A
    Comparison of Raman shift characteristics between A549 and Met-5A cells. Solid arrow indicates Raman peak at 1082 cm-1, and dotted arrow indicates Raman peak at 1155 cm-1
    Fig. 4. Comparison of Raman shift characteristics between A549 and Met-5A cells. Solid arrow indicates Raman peak at 1082 cm-1, and dotted arrow indicates Raman peak at 1155 cm-1
    Staining results of A549 and Met-5A cells with PAP and H&E, respectively. (a)(b)(e)(f) A549; (c)(d)(g)(h) Met-5A
    Fig. 5. Staining results of A549 and Met-5A cells with PAP and H&E, respectively. (a)(b)(e)(f) A549; (c)(d)(g)(h) Met-5A
    Peak position /cm-1MajorassignmentsPAPstain affinityH&E stainaffinity
    786DNA:O-P-O++
    1082O-P-O- stretch++
    1155C-N stretching (protein)+++
    1258Amide III--
    1304CH2 deformation (lipid)--
    1450CH2CH3 twistingmode(lipid)--
    1658Amide I (C=O stretchingmode of proteins,a-helix conformation)--
    Note: + and++ indicate affinity degree of H&E and PAP dyes with corresponding chemical groups; - indicates that H&E and PAP dyes are negatively colored with corresponding chemical groups.
    Table 1. Characteristic peak assignments for Raman spectra
    Characteristic parameterCellPAP (n=100)H&E (n=100)
    Energy varianceA5497.91419±1.665257.98664±1.68421
    Met-5A4.62469±1.375118.16944±1.83352
    t10.771-0.519
    p<0.0010.605
    Color meanA5497.06792±0.048927.11570±0.04107
    Met-5A7.10321±0.036027.05825±0.02611
    t-4.1098.347
    p<0.001<0.001
    Table 2. Image characteristic parameters of A549 and Met-5A cells stained by two dyes
    Yu Yang, Zhengrong Tao, Jing Yan, Shuxing Lü, Ran Wang, Xiaodan Liu, Xuguo Sun. Raman Shift Characteristics of Substance Expression and Accumulation Structure in Lung Cancer Cells[J]. Laser & Optoelectronics Progress, 2019, 56(15): 151701
    Download Citation