
Wenjin ZHANG, Qianqian SHEN, Jinbo XUE, Qi LI, Xuguang LIU, Husheng JIA. Preparation and Photoelectrochemical Water Oxidation of Hematite Nanobelts Containing Highly Ordered Oxygen Vacancies[J]. Journal of Inorganic Materials, 2021, 36(12): 1290
- Journal of Inorganic Materials
- Vol. 36, Issue 12, 1290 (2021)
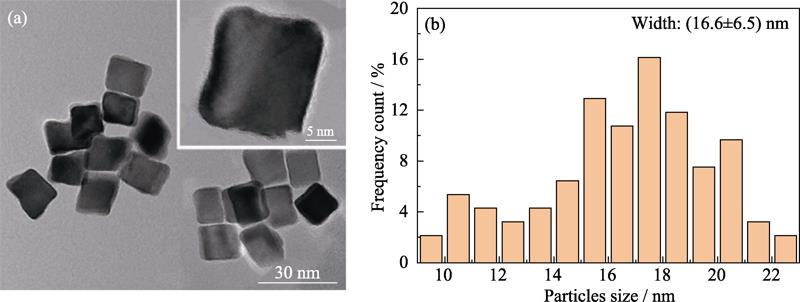
. (a) TEM images and (b) corresponding histogram of particle size distribution of Pd nanocrystals
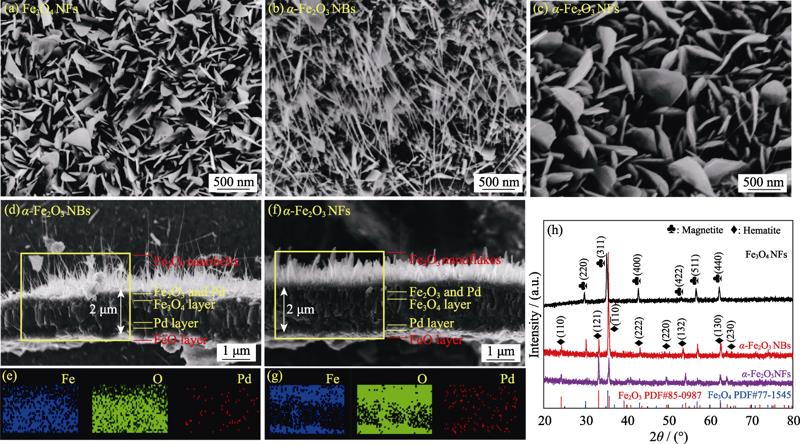
. Surface SEM images of (a) Fe3O4 NFs, (b) α-Fe2O3 NBs and (c) α-Fe2O3 NFs, (d, f)cross-sectional SEM images and (e, g) EDS mapping images of (d, e) α-Fe2O3 NBs, (f, g) α-Fe2O3 NFs; (h) XRD patterns of 3 photoanodes
. (a) Bright field TEM image, (b) typical HRTEM image from rectangular region in (a) and (c) corresponding fast Fourier transform (FFT) pattern, (d) enlarged HRTEM image, (e) crystal plane spacing measurement of α-Fe2O3 NBs
. (a, c) TEM images and (b, d) corresponding SAED patterns of (a, b) Fe3O4 NFs and (c, d) α-Fe2O3 NFs
. (a) XPS survey spectrum and high-resolution (b) Fe2p, (c) O1s, (d) Pd3d spectra of Fe3O4 NFs, α-Fe2O3 NBs and α-Fe2O3 NFs
. (a) LSV curves, (b) first-order derivatives of the photocurrent densities with respect to potential, (c) I-t curves at 1.23 V (vs. RHE), (d) stability test at 1.6 V (vs. RHE), (e) PEC hydrogen production diagram and (f) the hydrogen evolution rate diagram of Fe3O4 NFs, α-Fe2O3 NBs and α-Fe2O3 NFs
. (a) Surface photovoltage diagram, (b) electrochemical impedance spectra, (c) Mott-Schottky plots, and (d) Tafel plots of Fe3O4 NFs, α-Fe2O3 NBs and α-Fe2O3 NFs
. Schematic of α-Fe2O3 NBs containing highly ordered oxygen vacancies for efficient photoelectronchemical water splitting

Set citation alerts for the article
Please enter your email address
© Copyright 2018-2021 | Chinese Laser Press. All Rights Reserved 沪ICP备15018463号-20