
Mengsi Liu, Tian Xia, Shubo Cheng. Axial Multi-Vortex Beam Based on Thue-Morse Lens[J]. Acta Optica Sinica, 2018, 38(11): 1105001
- Acta Optica Sinica
- Vol. 38, Issue 11, 1105001 (2018)
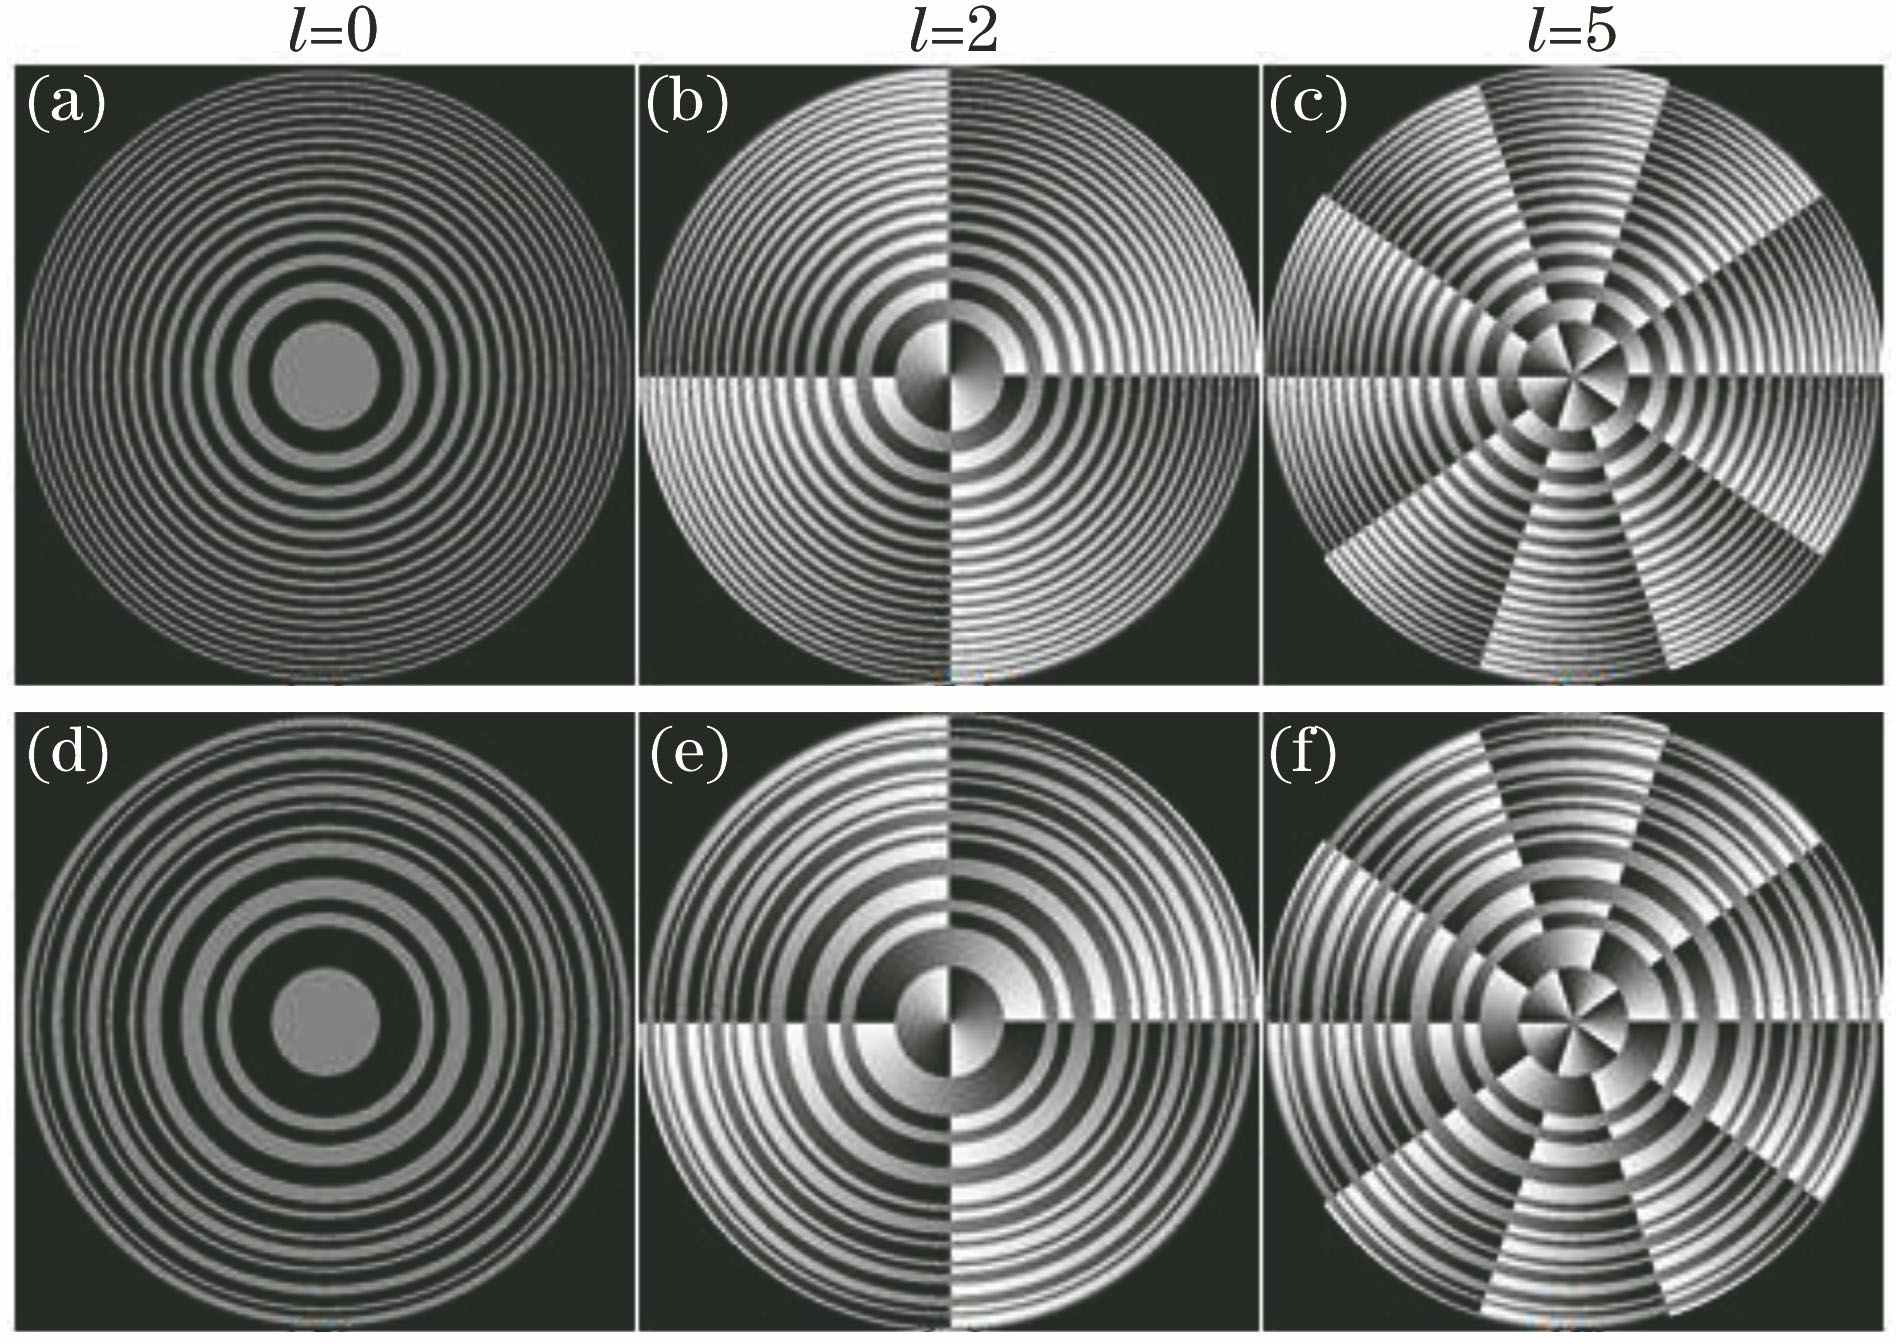
Fig. 1. Fresnel lenses and T-M vortex lenses with the topological charges of l=0, 2, 5, respectively. (a)-(c) Equivalent periodic Fresnel vortex lenses with the same number of zones; (d)-(f) T-M vortex lens based on the T-M sequence of order 5
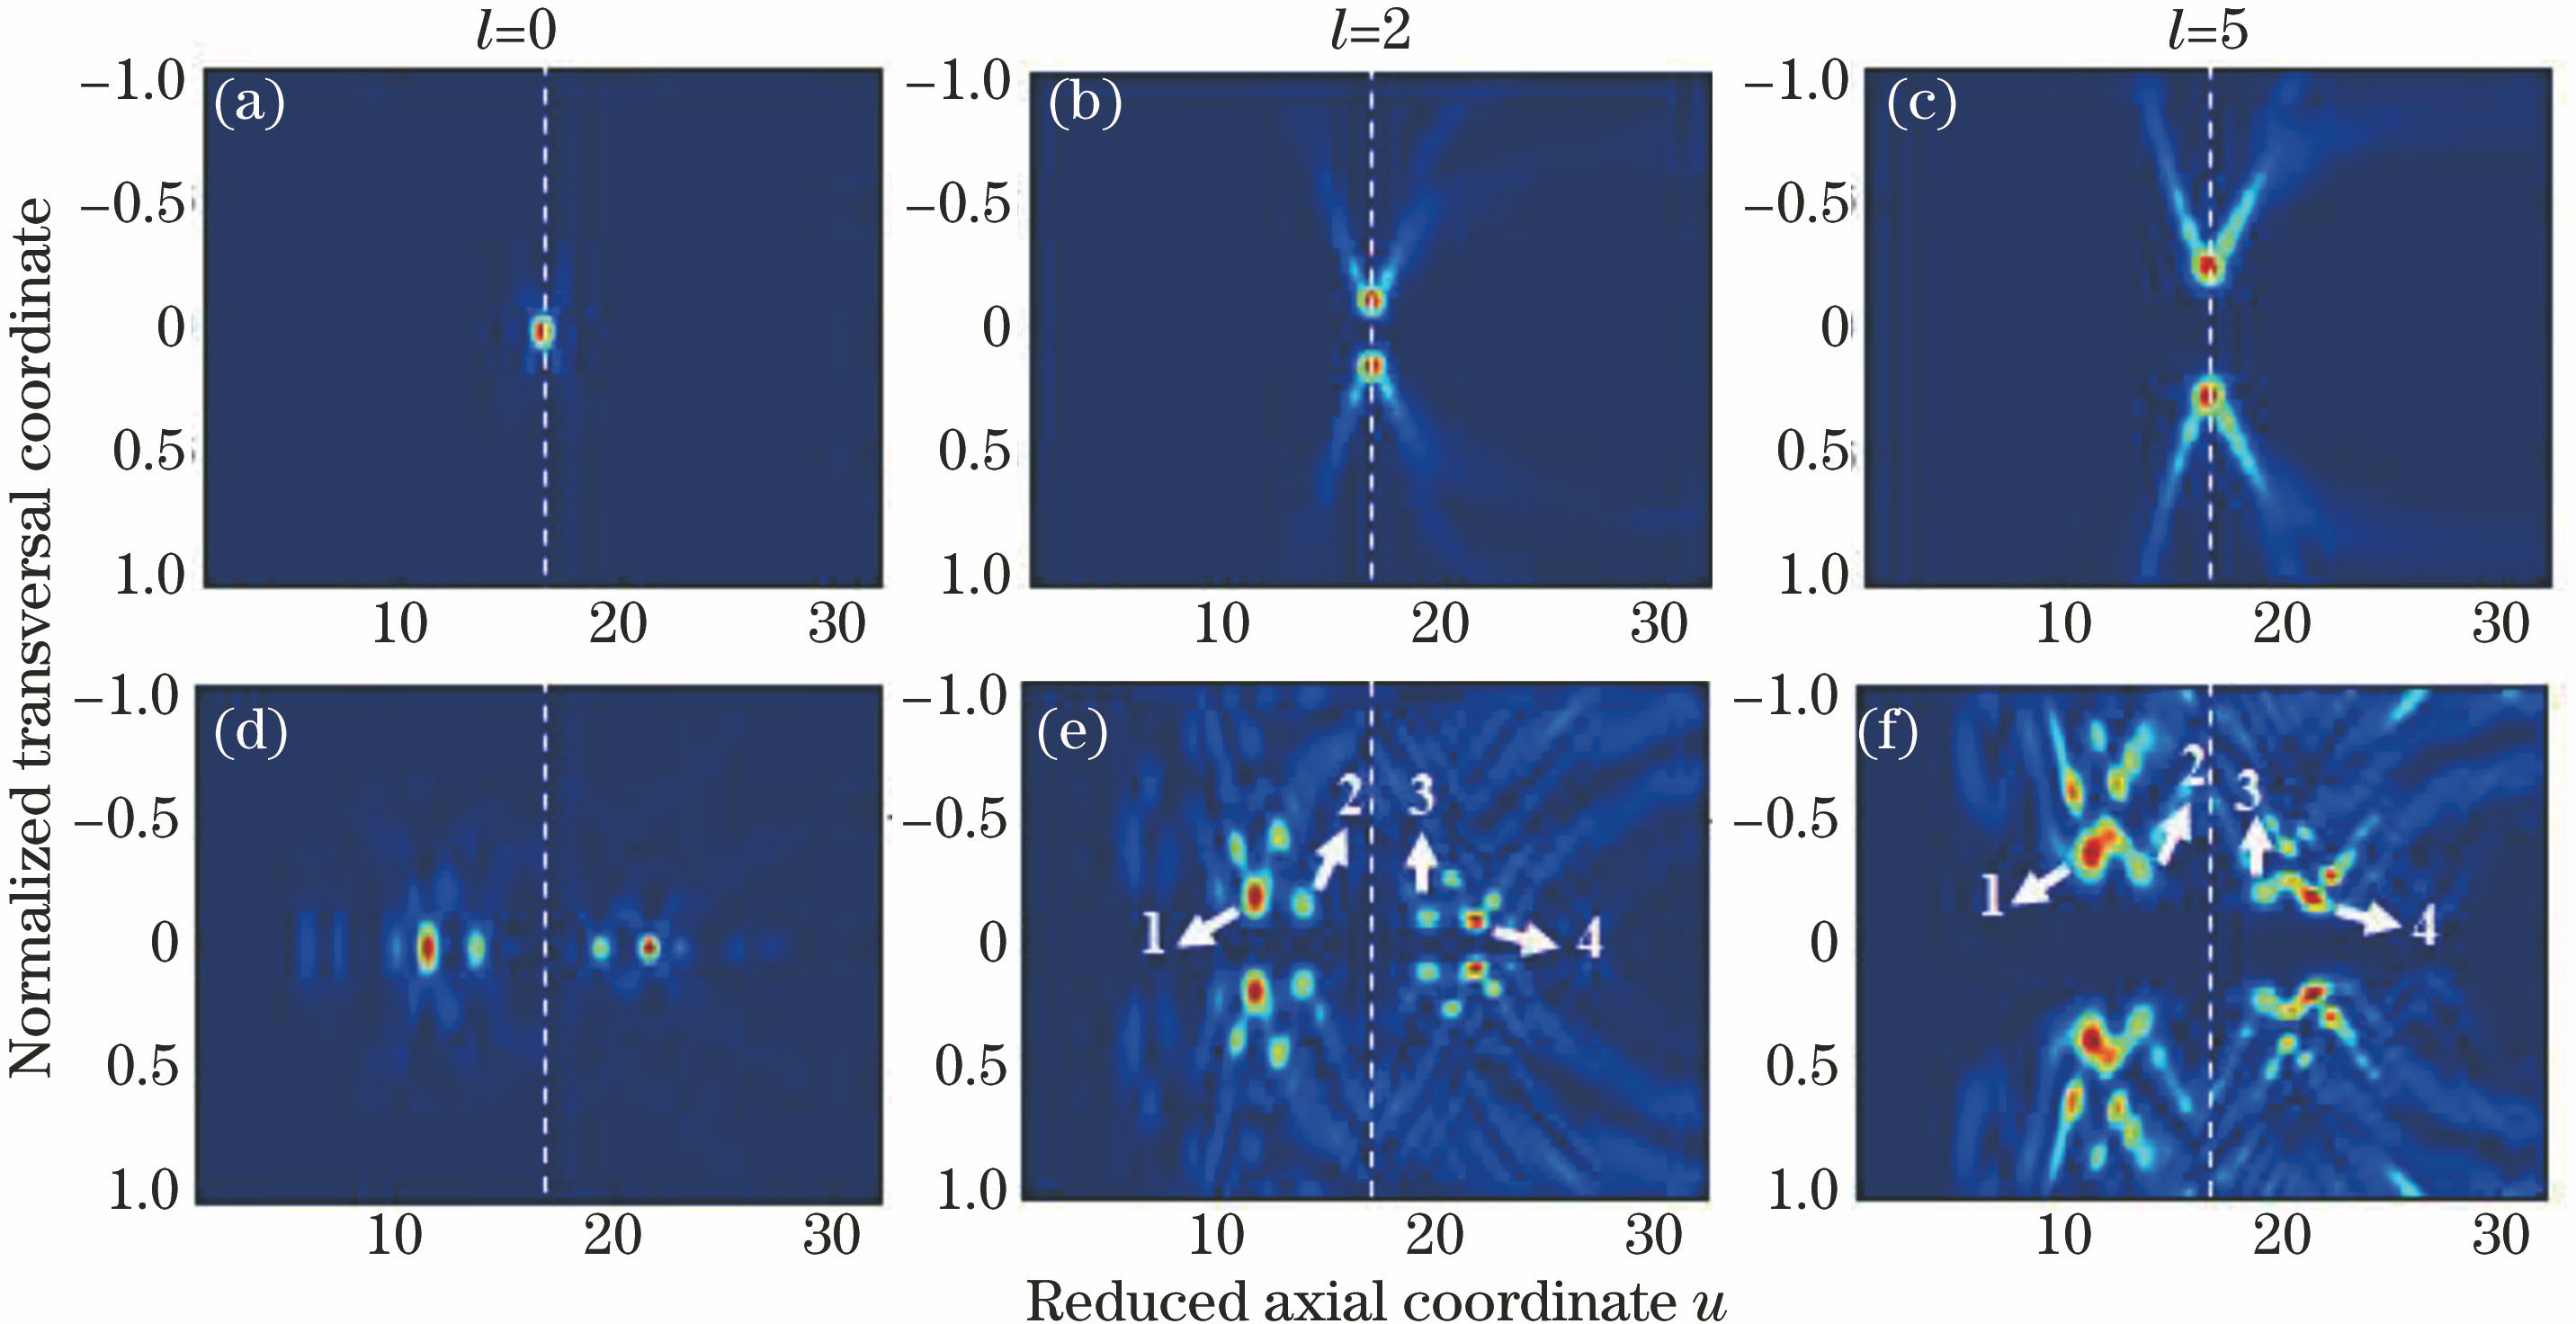
Fig. 2. Irradiance evolution of Fresnel lenses and T-M vortex lenses with the topological charges of l=0, 2, 5, respectively. (a)-(c) Evolution of the transverse irradiance of the Fresnel lens of order 5; (d)-(e)evolution of the transverse irradiance of the T-M vortex lens of order 5
Fig. 3. (a)-(b) Phase distribution in the two focal planes marked with 1 and 4 in Fig. 2(f); (c)-(d) transverse intensity distribution in the two focal planes marked with 1 and 4 in Fig. 2(f); (e)-(f) intensity profiles along the white dotted lines showed in Fig.3 (c) and Fig.3 (d)
Fig. 4. Schematic of the experimental setup
Fig. 5. (a)-(d) Simulated transverse irradiance distributions at the focal planes marked with 1, 2, 3 and 4 in Fig.2 (e)
Fig. 6. (a)-(d)Experimental transverse irradiance at the focal planes marked with 1, 2, 3 and 4 in Fig.2 (e)

Set citation alerts for the article
Please enter your email address
© Copyright 2018-2021 | Chinese Laser Press. All Rights Reserved 沪ICP备15018463号-20