
Haiyan Wang, Cheng Liu, Xiaoliang He, Xingchen Pan, Shenlei Zhou, Rong Wu, and Jianqiang Zhu. Wavefront measurement techniques used in high power lasers[J]. High Power Laser Science and Engineering, 2014, 2(3): 03000e25
- High Power Laser Science and Engineering
- Vol. 2, Issue 3, 03000e25 (2014)
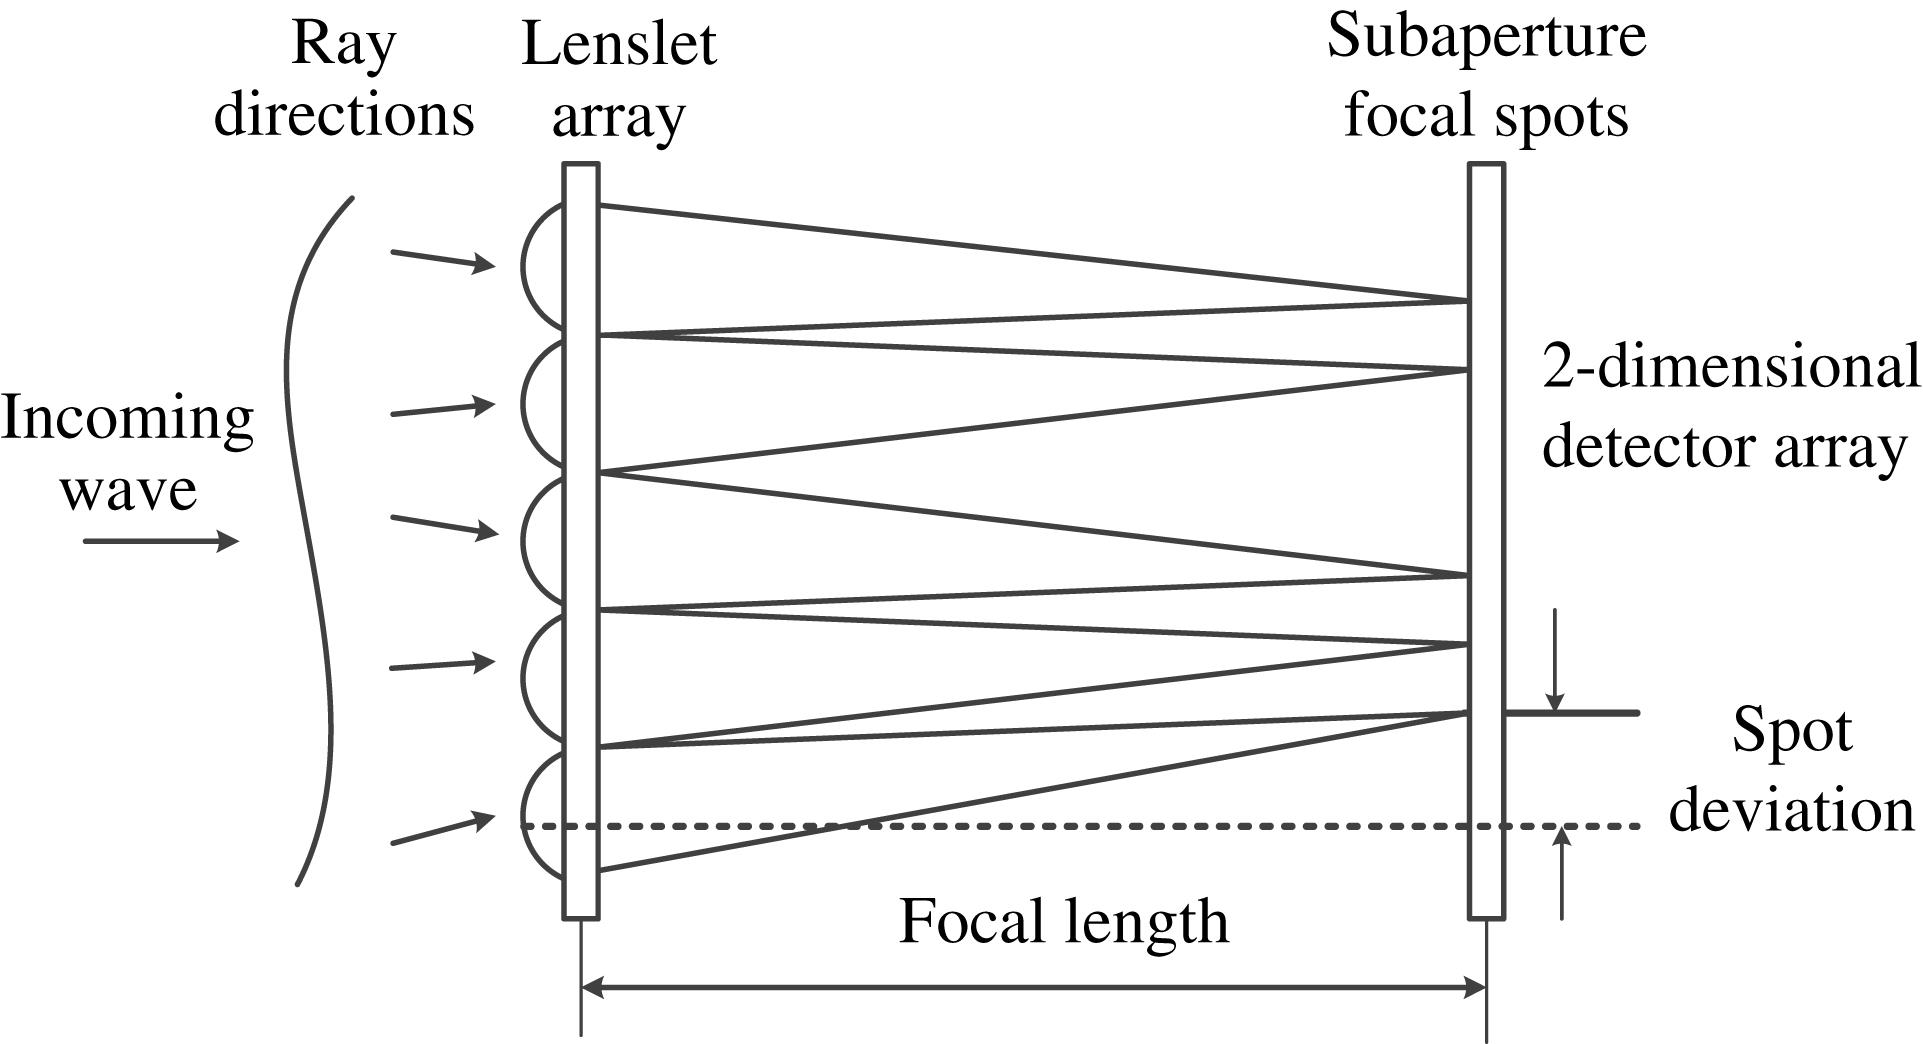
Fig. 1. Schematic of a Hartmann–Shack sensor.
![Overview of an OMEGA EP, showing the relative location of the main laser beam and the sample beam used by diagnostics for on-shot measurement of the laser properties. The FSD wavefront sensor is one of many laser diagnostics that characterize the sample beam (from Ref. [10]).](/richHtml/hpl/2014/2/3/03000e25/img_2.gif)
Fig. 2. Overview of an OMEGA EP, showing the relative location of the main laser beam and the sample beam used by diagnostics for on-shot measurement of the laser properties. The FSD wavefront sensor is one of many laser diagnostics that characterize the sample beam (from Ref. [10]).
Fig. 3. FSD measurements using the OPCPA front end (by Bromage). (a) Raw Hartmann–Shack image with inset showing the spots formed by each lenslet, (b) fluence (normalized), and (c) wavefront (in units of waves) (from Ref. [10]).
Fig. 4. Same-shot measurements of a focal spot using the FSD and FSM (by Bromage) and the diffraction-limited (DL) spot, which are calculated by setting the wavefront error to zero. (a–c) Linear scale plots; (d–f) logarithmic scale plots. The circles contain 80% of the energy (from Ref. [10]).
Fig. 5. Testing results of an ICF system. (a) Radial shearing interferogram with spatial PM, (b) phase of the tested laser wavefront, and (c) amplitude of the tested laser wavefront (from Ref. [14]).
Fig. 6. Designed and measured surfaces of a CPP with 380 mm diameter (from Ref. [18]).
Fig. 7. Geometric principle of the knife-edge test.
Fig. 8. Principle of a digitized Foucault tester.
Fig. 9. Measured intensity distributions (image 1 and image 2) and reconstructed wavefronts of 100 fs pulses at different output power levels (from Ref. [38]).
Fig. 10. Experimental arrangement used for phase retrieval measurements (from Ref. [39]).
Fig. 11. Recovered phases obtained by Brady and Fienup (from Ref. [39]).
Fig. 12. Linear scale comparison of the directly measured focal spot (a) in the presence of an aberrator with the focal spots calculated with and without the use ((b) and (c), respectively) of the transfer wavefront obtained from phase retrieval (from Ref. [42]).
Fig. 13. Histograms illustrating the effects of phase-retrieval improvements on a large population of measurements. (a) Sample beam focal-spot accuracy showing cross-correlation between the FSD prediction and the far-field CCD measurement. (b) Main-beam focal-spot accuracy showing cross-correlation between the FSD prediction and the FSM measurement (from Ref. [44]).
Fig. 14. Principles of PIE and ePIE (from Ref. [46]).
Fig. 15. Diffraction patterns with the illumination beam in overlapping positions.
Fig. 16. Experimental setup of the phase detection for large-aperture optical elements.
Fig. 17. (a) Manufactured CPP, (b) CPP design value, (c) measurement result of a Zygo interferometer, (d) wrapped phase of the measured modulation function, (e) unwrapped phase of the measured modulation function, and (f) the measured result and designed value along the horizontal lines of (b) and (e) (from Ref. [46]).
Fig. 18. Schematic of the PM technique. (a) Basic principle and (b) experimental setup.
Fig. 19. Experimental results of PM. (a) Reconstructed phase, (b) reconstructed modulus, (c) predicted focal spot with the PM technique, and (d) the measured focal spot.

Set citation alerts for the article
Please enter your email address
© Copyright 2018-2021 | Chinese Laser Press. All Rights Reserved 沪ICP备15018463号-20