
Haiyan Wang, Cheng Liu, Xiaoliang He, Xingchen Pan, Shenlei Zhou, Rong Wu, and Jianqiang Zhu, "Wavefront measurement techniques used in high power lasers," High Power Laser Sci. Eng. 2, 03000e25 (2014)
- High Power Laser Science and Engineering
- Vol. 2, Issue 3, 03000e25 (2014)
Abstract
1. Introduction
High power solid-state laser facilities for Inertial Confinement Fusion (ICF) employ thousands of large optical components, including amplifiers, polarizing films, electro-optical switches, lenses, and mirrors[
Wavefronts in high power lasers possess two distinguishing features. First, the laser beam to be measured is pulsed, which makes extraction of phase information using conventional phase-shifting techniques difficult. Second, the space for pulse synchronization and wave shaping optics inside the laser driver system is insufficient. An ideal phase measurement technique for an ICF system should feature high spatial resolution, high accuracy, simple setup, and rapid data acquisition. Given that most of the commonly used devices for wavefront measurement are unable to satisfy all of these requirements simultaneously and that the number of phase measurement techniques applicable to an ICF system is limited, several measurement techniques must be used in combination to obtain the required accuracy.
First, the current paper presents a general discussion on the wavefront measurement techniques applicable in ICF systems. Second, three traditional measurement methods, namely the Hartmann–Shack wavefront sensor, interferometry, and the knife-edge test, as well as their advantages and disadvantages, are discussed. Third, the development of Coherent Diffraction Imaging (CDI) and its application in high power laser systems is introduced in detail. Fourth, some newly developed techniques including the Ptychographical Iterative Engine (PIE) and Phase Modulation (PM) are introduced; some of their applications and potential applications in the field of high power laser systems are also demonstrated.
Sign up for High Power Laser Science and Engineering TOC. Get the latest issue of High Power Laser Science and Engineering delivered right to you!Sign up now
2. Traditional methods of phase measurement
Commonly used phase measurement techniques for ICF systems include the Hartmann–Shack wavefront sensor, interferometry, and the knife-edge technique, all of which are well-developed and commercialized techniques. The Hartmann–Shack wavefront sensor is used to detect online wavefronts and realize feedback control because of its high data acquisition speed and rapid computational processing. Interferometry is used to evaluate the properties of the optical elements. The knife-edge technique, which features the simplest structure among the three phase measurement techniques, is used to evaluate the characteristics of optics qualitatively. Apart from these traditional measurement techniques, the CDI method, which was developed for X-ray and electron beam imaging, is also used in some special cases and has shown significant advantages in high power lasers.
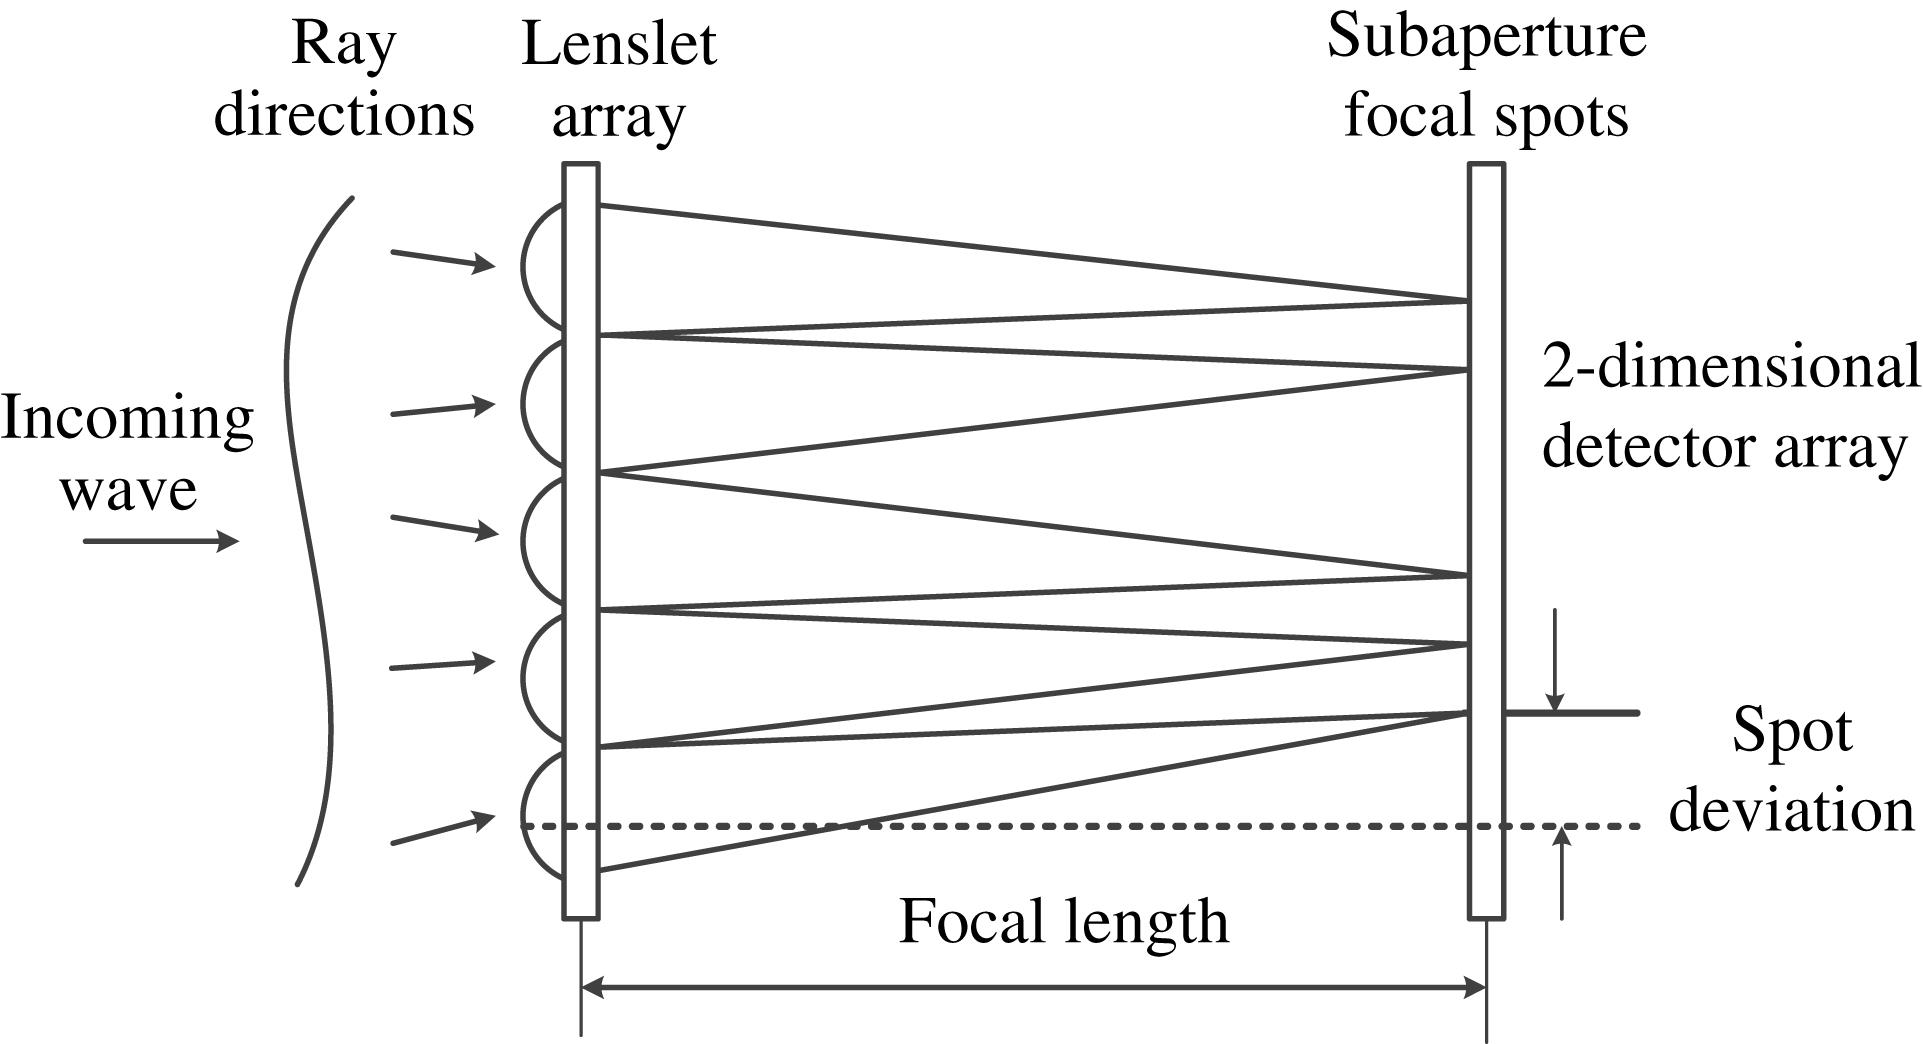
2.1. Hartmann–Shack wavefront sensor
The Hartmann–Shack wavefront sensor is mainly composed of a micro-lens array and a CCD camera (Figure  in the
  direction is related to the slope of the deformed wavefront:
 (1)
(1) is the focal length of the lenslet. In this way, the wavefront distortion is converted to the spot offsets at the CCD sensor plane, and the phase map of the wavefront can be generated by integrating the calculated slope.
The most remarkable advantages of the Hartmann–Shack sensor are its simple structure and rapid data processing; these merits allow the use of the sensor in measurement of dynamic wavefronts[
In OMEGA EP system, a Hartmann–Shack sensor of  lenslets is applied to set up a focal spot diagnostic (FSD) system to measure a lower energy sample of the main beam that is attenuated and down-collimated to a more convenient beam size (
 ). Stretched pulses (250 mJ, 8 nm square spectrum, 5 Hz) are amplified using a multipass Nd:glass amplifier and compressed by a tiled-grating compressor, then 99.5% of the compressed pulse energy is reflected by a diagnostic pickoff mirror and the remainder is transmitted as a sample beam for the laser diagnostics package. The Hartmann–Shack sensor is positioned at an image plane conjugate to the fourth compressor grating, as shown in Figure
  of the 100 mJ front end is focused in the target chamber, which provides enough energy for the FSD wavefront sensor and is not too high for the FSM. The image plane for this sensor is the last of the four tiled gratings inside the compressor. Figure
  lenslets), the wavefront cannot be captured accurately and the fine details of the focal spot cannot be faithfully represented; however, the encircled energies of these two measurements show good agreement. Figures
The Hartmann–Shack sensor is also used at National Ignition Facility (NIF)[ is achieved at 1.053 mm in the offline test.
In most cases, measurements obtained using the Hartmann–Shack sensor present the closest real wavefront, but the resolution and accuracy of this technique are significantly lower than those obtained from interferometry.
2.2. Interferometry
2.2.1. Traditional interferometry
Interferometry is a classic method to determine phase distributions and detect wavefronts. The light wave to be measured initially interferes with a regular spherical or planar reference wave to generate interference fringe patterns, and the resultant phase distribution is extracted from the recorded fringes using various methods, including phase shifting and fringe carriers. Given that interferometry is remarkably sensitive to environmental turbulence, such as mechanical vibration and air fluence, the interferometer must be installed on a vibration-isolated table inside a room at constant temperature and humidity to achieve high accuracy. Using the phase-shift technique and high resolution CCD, the highest measurement accuracy of interferometry can reach  in theory. Although the accuracy of interferometry is significantly higher than that of other techniques, its setup complexity and high requirement on its working environment limit its application in high power laser systems.
Interferometers used in high power lasers must possess large apertures because the diameters of large optical elements can reach up to half a meter. Given the difficulties associated with fabricating large reference standard mirrors and the related optical components, the cost of an interferometer increases drastically with its diameter, and its requirements on the working environment become more difficult to satisfy. To detect the machining quality of optical elements used at NIF, VEECO (USA) developed seven large Fizeau interferometers with diameters of up to 610 mm[ (PV) and the measurement repeatability depended on the test surface gradient. The interferometer applied by the French Atomic Energy Commission (CEA) has a diameter of 800 mm and is the largest interferometer ever reported. In addition to optical element measurements, the Fizeau laser interferometer is also used in adjusting the optical alignment[
Interferometers are capable of performing phase measurement with high accuracy and can meet the requirements of most high power laser applications in terms of resolution and aperture size. However, the use of interferometers to detect wavefronts online is difficult because of their complex structure and complicated environmental requirements.
2.2.2. Shearing interferometry
The reference standard mirror used in classic interferometry must be fabricated at an accuracy one order higher than that for a common optical element. Fabrication of a large reference mirror that is suitable for use in high power lasers remains challenging. Shearing interferometers do not need an accurate reference standard mirror; they possess simple structures, strong anti-interference abilities, and stable stripes. In theory, shearing interferometers are a good alternative to traditional interferometers for measuring the quality of optical elements and light beam wavefronts. Shearing interferometers can be classified into lateral and radial shearing interferometers. Given that two orthogonal shearing interferograms at precise displacements in the  and
and  directions are necessary for lateral shearing interferometers, the wavefront retrieval process is markedly complex and error prone. Although the cross-grating lateral shearing interferometer has been proposed to test the density distribution of deuterium–tritium (DT) ice in ICF experiments and the root-mean-square error has been found to be
  [
[ in computer simulations. Figure
Given that shearing interferometers measure the phase variance and that the measured phase map indicates the differential distribution of the wavefront, these instruments are not as intuitive as classic interferometers. Complicated imaging processing and wavefront reconstruction algorithms are necessary to retrieve the wavefront from the differential data, thereby limiting the applications of shearing interferometers.
2.2.3. Subaperture stitching method
In classical interferometry, the elements to be measured are imaged by a CCD camera. Thus, the resolution is  , where
  is the size of the element to be measured and
  is the pixel number of the CCD camera. The spatial resolution of a 400 mm diameter element and a CCD with
  is approximately
  , which is too low for most high power laser applications. Subaperture stitching interferometers can measure the large optical components of various subapertures, after which the measurements are stitched together to obtain a high resolution. This measurement method has been used to measure large optical elements with sizes of up to
  at Laser Méga Joule and NIF[
 [
[
The use of subaperture stitching interferometers significantly reduces cost and increases spatial resolution[
2.3. Knife-edge test method
2.3.1. Traditional Foucault method
The knife-edge method was proposed by Foucault in 1858[ is an ideal spherical surface with center
  . When a point source is placed at
  , the light from
  to
to  coincides with the normal direction of the corresponding surface element and the reflected light returns to
  . When the knife-edge cuts the reflected beam from right to left, the mirror is observed behind the knife-edge. When the knife-edge is located at position 1, the shadow on
  darkens from right to left, i.e., the shadow and knife-edge move in the same direction. The entire field is bright if the knife-edge has not met point
  and when the knife-edge is located at position 2, which is at the center of the sphere;
  darkens immediately when the knife-edge first cuts through point
  . When the knife-edge cuts the light at position 3, the shadow on
  darkens from left to right, which is opposite to the moving direction of the knife-edge. This method is sensitive to slopes rather than heights, and only one direction can be measured at a single orientation of the knife-edge.
Given that only qualitative measurements can be realized by the traditional Foucault test method, a digitized Foucault tester (Figure
When a point source is located at the center of a spherical mirror, the returning beam focuses on the same position as the point source if the mirror under testing possesses an ideal spherical surface. When defects are present on the surface of the mirror, the returning beam deviates from the focal point and reaches a new location. The angle by which it departs from the ideal position can be calculated as follows:
 (2)
(2) is the refractive index of air and
  is the wave aberration. The deviation of the returning beam from the ideal position
  and
and  can be calculated from the location of the knife-edge, and the wave aberration of the mirror can be obtained using
  (3)
(3) ,
,  , and
, and  is the radius of curvature.
The performance of the digitized Foucault test method has been compared with that of interferometry[
3. CDI technology and its applications
3.1. Development of CDI
CDI is a phase-retrieval method based on computer iterative calculations. The original purpose of CDI is imaging of the wave phase using X-rays and electron beams when high quality optics are unavailable. Given its outstanding advantages, which include simple setup, compact structure, and low environmental requirements, CDI has been used in high power laser systems to measure wavefronts and predict focus.
The principle of CDI was first developed by Hoppe in the 1970s and then improved by Fienup. The main theories include the Gerchberg–Saxton (G–S) algorithm, the error-reduction algorithm, and the input–output algorithm[
3.2. Applications of traditional CDI
The wavefront of a high power laser system is easily distorted because of the high complexity of the system, which contains thousands of optical elements. The wavefront of the laser beam is difficult to control because it involves routing tasks of all of the ICF facilities. However, most of the commonly used measurement techniques do not satisfy the requirements for accurate online measurement because of the compact structure and limited inner space of CDI. In 2000, CDI was first used to measure the phase of high power laser beams[
In 2006 Brady and Fienup[
Knowledge of the focus is important in conducting physical experiments. The focal spots of a high power laser system can be highly structured because of the complexity of the facility, which contains hundreds of optical surfaces. However, measurement of the focus field varies significantly[
In 2010, the CDI algorithm was used to form a FSD to predict the focus of an OMEGA EP laser at the University of Rochester’s Laboratory for Laser Energetics[ and
and  to
to  and
and  , respectively. The error in the transfer wavefront measurement was then measured by CDI using the data recorded in the FSM. The correlation between the FSD prediction and the direct FSM measurement was improved to
  using the corrected transfer wavefront. Using the measured complex amplitude and transfer function, the focal spot of the main laser beam inside the chamber could be accurately predicted.
This diagnostic method was evaluated on the OMEGA EP laser beam over a population of 175 shots to illustrate its reliability and stability; the evaluation was conducted for approximately 18 months from 2010 to 2012[ with
with  probability) between the measurements of FSD and FSM are also indicated. These diagnostics are used as a key tool for focal spot checking in the OMEGA EP laser.
4. PIE and its application
PIE is a newly developed CDI method proposed by Rodenburg in 2004 to overcome the disadvantages of traditional CDI[
4.1. Basic principles
For clarity, the principles of PIE and ePIE are outlined in Figure  (
( (
( (
(
(1) The exit field at the current position  is calculated with two random guesses for
  and
and 
 (4)
(4) represents the
  th iteration.
(2) The wavefunction in the data recording plane is calculated from the Fourier transform of  :
:
 (5)
(5)(3) The amplitude of  is replaced by the square root of
  :
:
 (6)
(6)(4) The guess is updated at the exit field by inverse Fourier transform:
 (7)
(7)(5) The functions  and
and  are updated with the following formulas:
 (8)
(8) (9)
(9)4.2. Measurement of the transmittance of a large optical element with the use of ePIE
Illumination on the specimen in Figure  of the light leaving the convergent lens can be measured using the ePIE algorithm when the CPP is removed (Figure
  of the light leaving the CPP can also be measured. By subtracting
  from
from  , the PM of the CPP is obtained.
Figure
4.3. PM technique and its potential application
The data acquisition time of ePIE is several minutes; thus, it cannot be used to measure dynamic wavefronts. To overcome this disadvantage, Zhang proposed the PM method[
The modulator with a designed transmission function is located between the entrance and detector domains, while the entrance plane is the focal plane of the incident wave to be measured. As one frame of the diffraction pattern is recorded, the illumination on the modulator plane can be iteratively reconstructed at high accuracy. This method features a very simple structure and short data acquisition time; thus, it is suitable for FSDs and laser plasma imaging, where the laser beam is pulsed and most of the common techniques do not work well. Proof of concept is demonstrated by measuring a seriously distorted convergent He–Ne laser beam; Figures
Summary
The use of several traditional phase measurement methods to measure the wavefront in high power laser applications was evaluated; their advantages, disadvantages, and applications were also discussed. As a classical technique, interferometry features the highest accuracy and resolution among the techniques studied. However, in most cases, interferometry is only used to measure the static properties of optical elements because of its complex structure and critical environmental requirements. The Hartmann–Shack wavefront sensor shows high measurement speed and may be used to realize feedback wavefront control. However, this sensor cannot detect high frequency components. CDI techniques have been increasingly adopted in high power laser applications and are to be considered as promising techniques in special cases. CDI techniques are based on principles that are entirely different from those of traditional techniques and were developed particularly for imaging using short-wavelength radiation.
References
[4] W. H. Williams, J. M. Auerbach, M. A. Henesian. Proc. SPIE, 3264, 93(1998).
[5] W. H. Williams, J. M. Auerbach, M. A. Henesian, J. K. Lawson, P. A. Renard, R. A. Sacks. Proc. SPIE, 3492, 22(1998).
[6] B. M. Van Wonterghem, J. T. Salmon, R. W. Wilcox. Inertial Confinement Fusion Quarterly Report, 5, 4251(1994).
[7] V. I. Bespalov, V. I. Talanov. JETP Lett., 3, 307(1996).
[8] T. J. Brennan, D. J. Wittich. Opt. Eng., 52, 071416(2013).
[9] A. R. Saad, J. B. Martin. Appl. Opt., 52, 5523(2013).
[10] J. Bromage, S.-W. Bahk, D. Irwin, J. Kwiatkowski, A. Pruyne, M. Millecchia, M. Moore, J. D. Zuegel. Opt. Express, 16, 16561(2008).
[11] C. Ai, R. Knowiden, J. Lamb. Proc. SPIE, 3134, 47(1997).
[12] T. Ling, D. Liu, L. Sun, Y. Yang, Z. Cheng. Proc. SPIE, 8838, 88380J(2013).
[13] D. Malacara. Optical Shop Testing(2007).
[14] D. Liu, Y. Yang, J. Weng, X. Zhang, B. Chen, X. Qin. Opt. Commun., 275, 173(2007).
[15] C. R. Wolfe, J. D. Downie, J. K. Lawson. Proc. SPIE, 2870, 553(1996).
[16] D. M. Aikens, C. R. Wolfe, J. K. Lawson. Proc. SPIE, 2576, 281(1995).
[17] M. Bray. Third International Conference on Solid State Lasers for Application to Inertial Confinement Fusion, 946(1998).
[19] J. Thunen, O. Kwon. Proc. SPIE, 351, 19(1982).
[20] W. Chow, G. Lawrence. Opt. Lett., 8, 468(1983).
[21] M. Otsubo, K. Okada, J. Tsujiuchi. Opt. Eng., 33, 608(1994).
[22] S. Chen, S. Li, Y. Dai, Z. Zheng. Appl. Opt., 46, 3504(2007).
[23] J. Fleig, P. Dumas, P. E. Murphy, G. W. Forbes. Proc. SPIE, 5188, 296(2003).
[24] D. E. Vandenberg, W. D. Humbel, A. Wertheimer. Opt. Eng., 32, 1951(1993).
[25] L. Yuan, Z. Wu. Proc. SPIE, 7654, 765402(2010).
[26] H. Song, G. Vdovin, R. Fraanje, G. Schitter, M. Verhaegen. Opt. Lett., 34, 61(2009).
[27] B. Xuan, J. Li, S. Song, J. Xie.
[28] J. R. Fienup. Opt. Lett., 3, 27(1978).
[29] J. M. Zuo, I. Vartanyants, M. Gao, R. Zhang, L. A. Nagahara. Science, 300, 1419(2003).
[31] J. M. Rodenburg, H. M. L. Faulkner. Appl. Phys. Lett., 85, 4795(2004).
[33] H. N. Chapman. Nat. Mater., 8, 299(2009).
[36] E. Osherovich, Y. Shechtman, A. Szameit, P. Sidorenko, E. Bullkich, S. Gazit, S. Shoham, E. B. Kley, M. Zibulevsky, I. Yavneh, Y. C. Eldar, O. Cohen, M. Segev. Precision Imaging and Sensing (CF3C), San Jose, CA, USA(2012).
[38] S. Matsuoka, K. Yamakawa. J. Opt. Soc. Am. B, 17, 663(2000).
[39] G. R. Brady, J. R. Fienup. Optical Fabrication and Testing, Rochester, NY, USA(2006).
[40] T. J. Kessler, J. Bunkenburg, H. Huang, A. Kozlov, D. D. Meyerhofer. Opt. Lett., 29, 635(2004).
[41] S. W. Bahk, J. Bromage, J. D. Zuegel, J. R. Fienup. Conference on Lasers and Electro-Optics, San Jose, CA, USA(2008).
[43] B. E. Kruschwitz, S. W. Bahk, J. Bromage, D. Irwin, M. D. Moore, L. J. Waxer, J. D. Zuegel, J. H. Kelly. Conference on Lasers and Electro-Optics, San Jose, CA, USA, JThE113(2010).
[44] B. E. Kruschwitz, S. W. Bahk, J. Bromage, D. Irwin. Opt. Express, 20, 20874(2012).
[45] H. M. L. Faulkner, J. M. Rodenburg. Ultramicroscopy, 103, 153(2005).
[46] H. Y. Wang, C. Liu, S. P. Veetil. Opt. Express, 22, 2159(2014).
[49] F. Zhang, J. M. Rodenburg. Phys. Rev. B, 82, 121104(2010).


Set citation alerts for the article
Please enter your email address

© Copyright 2018-2021 | Chinese Laser Press. All Rights Reserved 沪ICP备15018463号-20