
Bin Zhang, Shengpeng Wan, Sijun Zhang, Zhengping Zhang, Haihua Zhong. Indoor Positioning System Based on Support Vector Machine[J]. Laser & Optoelectronics Progress, 2022, 59(16): 1615005
- Laser & Optoelectronics Progress
- Vol. 59, Issue 16, 1615005 (2022)
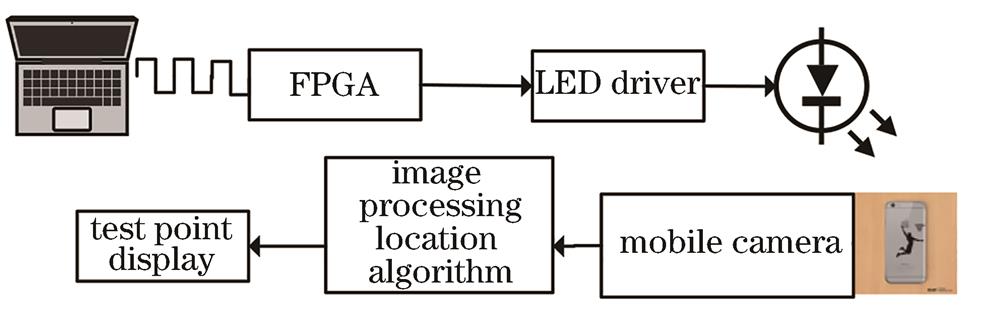
Fig. 1. Overall block diagram of visible light indoor positioning system
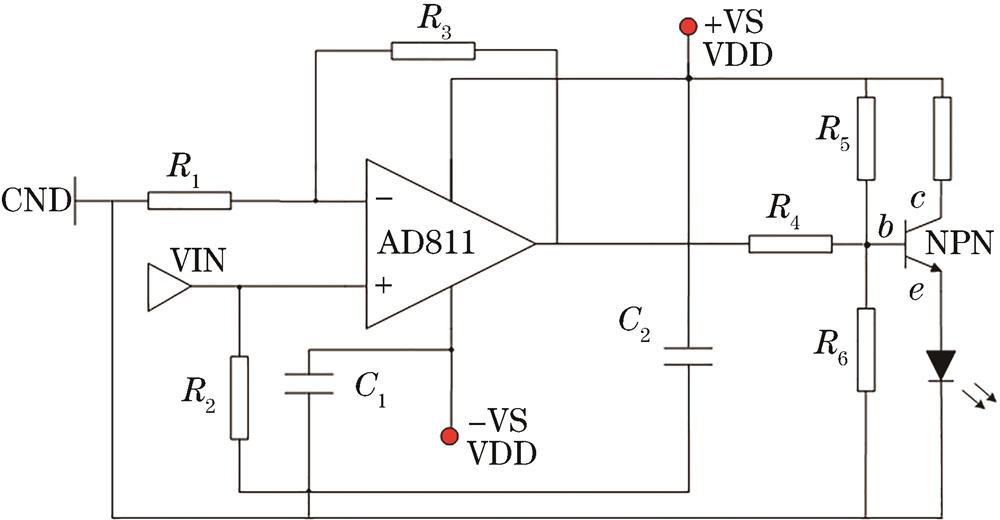
Fig. 2. LED drive circuit
Fig. 3. Flow chart of coding RTL
Fig. 4. Singal waveform of LED
Fig. 5. Effects of LED-ID light stripe code under different exposure. (a) 1/500; (b) 1/1000; (c) 1/2000
Fig. 6. Effects of LED-ID light stripe code under different sensitivity. (a) 1000; (b) 200; (c) 50
Fig. 7. Effects of light stripe code at different frequencies[11]. (a) 1500 Hz; (b) 2000 Hz; (c) 3000 Hz
Fig. 8. Effects of light stripe code under different duty cycle. (a) 25%; (b) 50%; (c) 75%
Fig. 9. Effects of light stripe code under different distances. (a) 10 cm; (b) 20 cm; (c) 30 cm
Fig. 10. Selection of duty cycle column pixels
Fig. 11. Column pixel grayscale
Fig. 12. Support vector
Fig. 13. Three-dimensional diagram of LED-ID recognition
Fig. 14. Side view of LED-ID recognition
Fig. 15. Transformation relation of coordinate system
Fig. 16. System model of proposed location algorithm
Fig. 17. Different situations of rotation angle φ
Fig. 18. Light distribution map
Fig. 19. Three-dimensional diagram of positioning results
Fig. 20. top view of positioning results
Fig. 21. Distribution of positioning error

Set citation alerts for the article
Please enter your email address
© Copyright 2018-2021 | Chinese Laser Press. All Rights Reserved 沪ICP备15018463号-20