• Journal of Infrared and Millimeter Waves
  • Vol. 40, Issue 4, 508 (2021)
Yi-Ming FANG1、2, Zhen YANG1、2, Pei-Peng XU1、2, Kun-Lun YAN1、2, Yan SHENG1、2, and Rong-Ping WANG1、2、3、*
Author Affiliations
  • 1Laboratory of Infrared Materials and Devices, Ningbo University, Ningbo 315211, China
  • 2Key Laboratory of Photoelectric Detection Materials and Devices of Zhejiang Province, Ningbo 315211, China
  • 3Laboratory of Silicate Materials Science and Engineering, Wuhan University of Technology, Wuhan 430070, China
  • show less
    DOI: 10.11972/j.issn.1001-9014.2021.04.010 Cite this Article
    Yi-Ming FANG, Zhen YANG, Pei-Peng XU, Kun-Lun YAN, Yan SHENG, Rong-Ping WANG. Dispersion engineered ZnSe rib waveguide for mid-infrared supercontinuum generation[J]. Journal of Infrared and Millimeter Waves, 2021, 40(4): 508 Copy Citation Text show less
    (a) ZnSe waveguide structure, (b) refractive index of the core layer ZnSe, the cladding layer Ga2As30S68 and Ge5As10S85.
    Fig. 1. (a) ZnSe waveguide structure, (b) refractive index of the core layer ZnSe, the cladding layer Ga2As30S68 and Ge5As10S85.
    Calculated dispersion curves of the fundamental quasi-TE (a) the dispersion parameter curves for the fundamental quasi-TE mode calculated from neff for eight waveguide geometries employing Ga2As30S68 glass for both the upper and lower claddings, (b) and (c) Map of the dispersion parameter of w=4 and 8 μm ZnSe rib waveguides as a function of core thickness and wavelength, respectively, employing Ge5As10S85 glass for both the upper and lower claddings. The dash lines show the change of the ZDWs
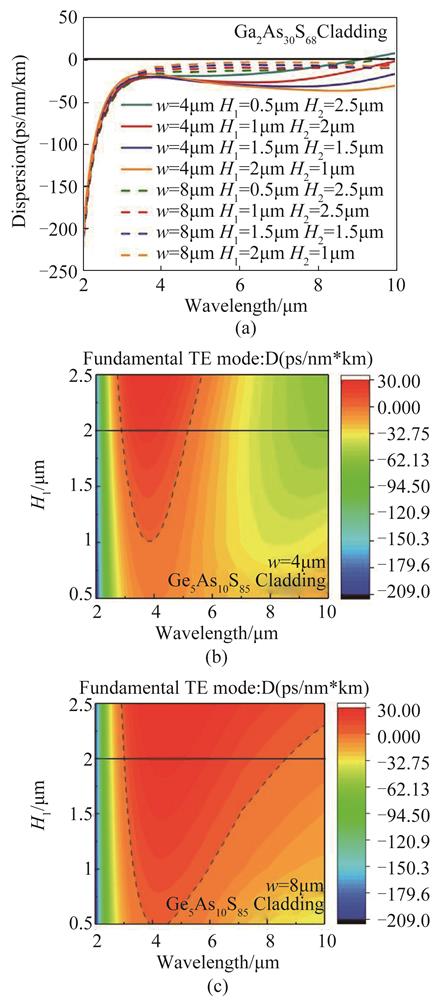
    Fig. 2. Calculated dispersion curves of the fundamental quasi-TE (a) the dispersion parameter curves for the fundamental quasi-TE mode calculated from neff for eight waveguide geometries employing Ga2As30S68 glass for both the upper and lower claddings, (b) and (c) Map of the dispersion parameter of w=4 and 8 μm ZnSe rib waveguides as a function of core thickness and wavelength, respectively, employing Ge5As10S85 glass for both the upper and lower claddings. The dash lines show the change of the ZDWs
    The optical filed distribution for quasi-TE polarization in the waveguide (a-c) for w=4 μm, and (d-f) for w=8 μm waveguide with H1=2 μm and H2=1 μm at a wavelength of 2, 6, and 10 μm, respectively
    Fig. 3. The optical filed distribution for quasi-TE polarization in the waveguide (a-c) for w=4 μm, and (d-f) for w=8 μm waveguide with H1=2 μm and H2=1 μm at a wavelength of 2, 6, and 10 μm, respectively
    Effective area and nonlinear coefficient of the fundamental mode calculated in the waveguides (a) w = 4 μm, H1=2 μm, and H2=1 μm (b) w = 8μm, H1=2 μm, and H2=1 μm. (c) Dispersion distribution of the waveguides with w = 4 and 8μm. (d) The second-order dispersion of the waveguides with w = 4 and 8 μm.
    Fig. 4. Effective area and nonlinear coefficient of the fundamental mode calculated in the waveguides (a) w = 4 μm, H1=2 μm, and H2=1 μm (b) w = 8μm, H1=2 μm, and H2=1 μm. (c) Dispersion distribution of the waveguides with w = 4 and 8μm. (d) The second-order dispersion of the waveguides with w = 4 and 8 μm.
    Simulated SC spectra at a pump wavelength of (a) 3.0 µm, (b) 4.5 µm, (c) 3.0 µm and (d) 4.5 µm for the two waveguides at different peak power up to 20 kW, respectively.
    Fig. 5. Simulated SC spectra at a pump wavelength of (a) 3.0 µm, (b) 4.5 µm, (c) 3.0 µm and (d) 4.5 µm for the two waveguides at different peak power up to 20 kW, respectively.
    Simulated SC spectra at different pump wavelengths of (a) 3.0 µm, (b) 3.5 µm, (c) 4.0 µm, and (d) 4.5 µm for the two waveguides with a peak power of 20 kW, respectively.
    Fig. 6. Simulated SC spectra at different pump wavelengths of (a) 3.0 µm, (b) 3.5 µm, (c) 4.0 µm, and (d) 4.5 µm for the two waveguides with a peak power of 20 kW, respectively.
    The spectral evolution plots and temporal density plots corresponding to two curves in Fig. 5.2 (d) at a peak power of 20 kW for (a) the spectral evolution plot of 4 μm waveguide, (b) the spectral evolution plot of 8 μm waveguide, (c) the temporal density plot of 4 μm waveguide, (d) the temporal density plot of 8 μm waveguide.
    Fig. 7. The spectral evolution plots and temporal density plots corresponding to two curves in Fig. 5.2 (d) at a peak power of 20 kW for (a) the spectral evolution plot of 4 μm waveguide, (b) the spectral evolution plot of 8 μm waveguide, (c) the temporal density plot of 4 μm waveguide, (d) the temporal density plot of 8 μm waveguide.
    MaterialsA1A2A3λ12λ22λ32
    ZnSe4.925 73.247 7e-522.206 30.051 319.31516 574
    Ga2As30S684.044 51.323 6e-41.282e-50.039 514.10729.575
    Ge5As10S853.154 6-3.007 5e-4-0.058 10.071 915.124-196.7
    Table 1. Refractive coefficient of ZnSe, Ga2As30S68, and Ge5As10S85.
    Yi-Ming FANG, Zhen YANG, Pei-Peng XU, Kun-Lun YAN, Yan SHENG, Rong-Ping WANG. Dispersion engineered ZnSe rib waveguide for mid-infrared supercontinuum generation[J]. Journal of Infrared and Millimeter Waves, 2021, 40(4): 508
    Download Citation