
Weizhe Wang, Han Wu, Cheng Liu, Biao Sun, Houkun Liang, "Multigigawatt 50 fs Yb:CALGO regenerative amplifier system with 11 W average power and mid-infrared generation," Photonics Res. 9, 1439 (2021)
- Photonics Research
- Vol. 9, Issue 8, 1439 (2021)
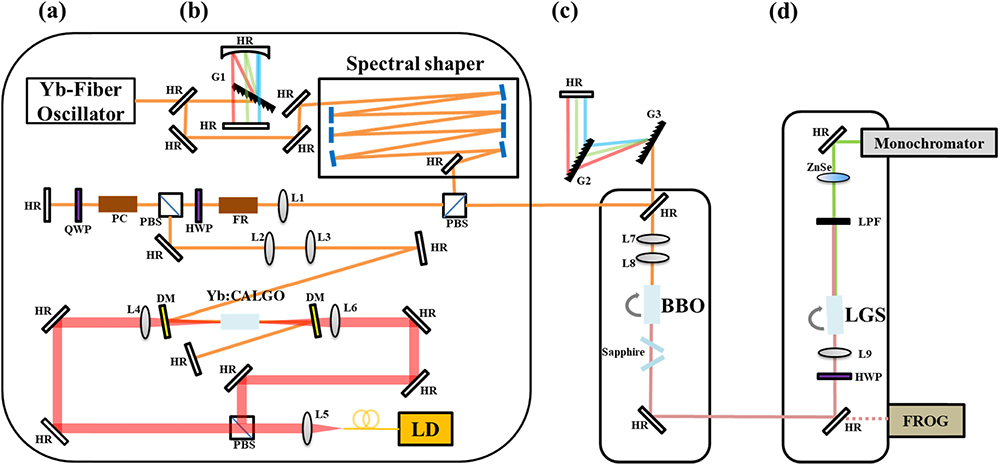
Fig. 1. Schematics of (a) front end, (b) regenerative amplifier, (c) cascaded-quadratic compressor, and (d) mid-infrared (MIR) intrapulse difference-frequency generation (IPDFG) stage. The front end consists of an Yb-fiber oscillator and a designed spectral shaper. The regenerative amplifier employs an Yb:CALGO crystal. HR, high reflection mirror; PBS, polarization beam splitter; L, lens; FR, Faraday rotator; HWP, half-wave plate; PC, Pockels cell; QWP, quarter-wave plate; DM, dichroic mirror; LD, laser diode; LPF, low-pass filter; G, high-efficiency transmission grating with 1600 lines/mm; LGS, LiGaS 2
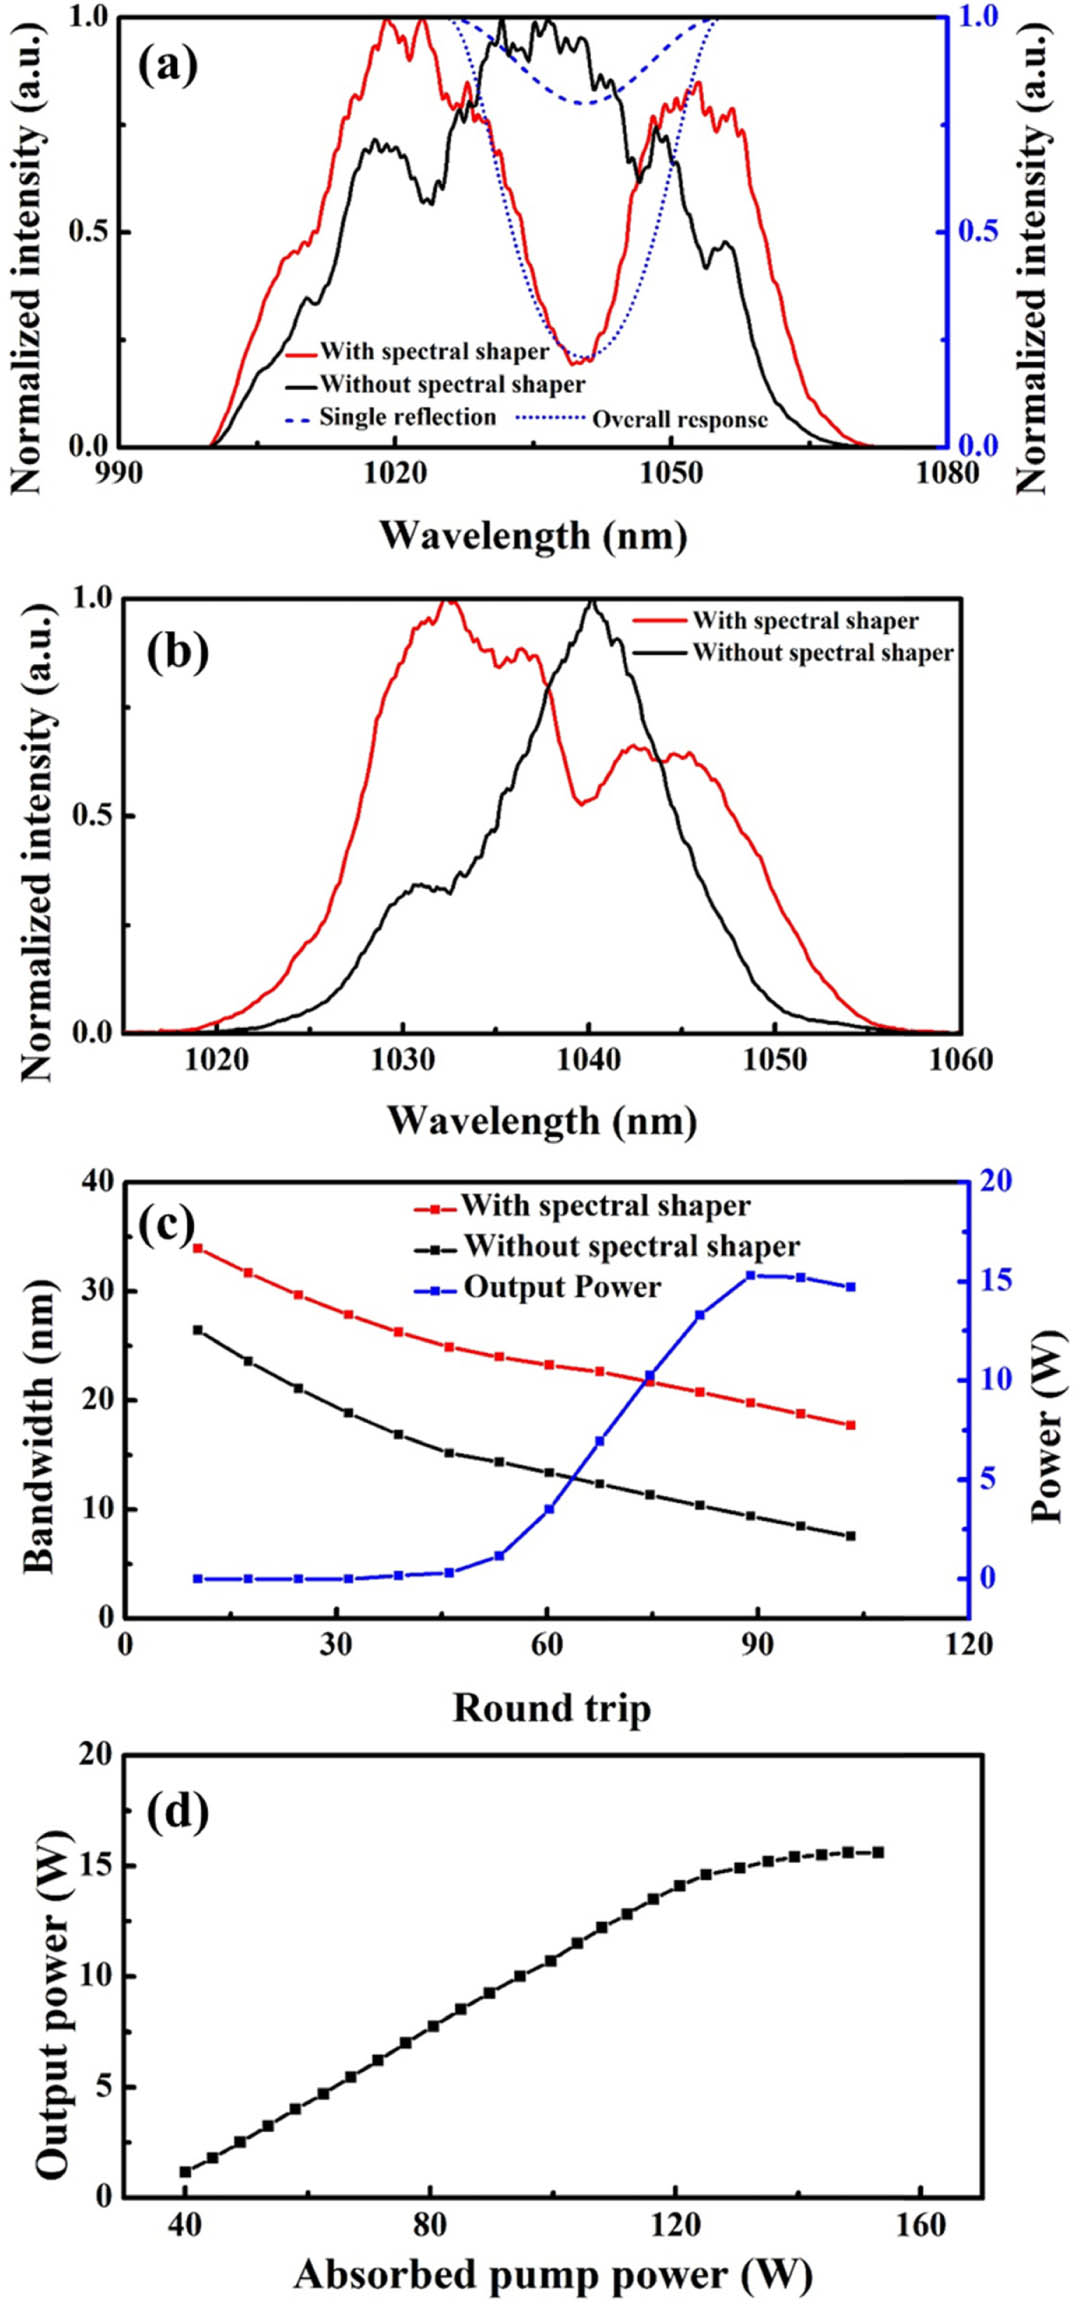
Fig. 2. (a) Comparison of the seed spectrum with (red) and without (black) the spectral shaper. The single reflection (blush dash) and overall response (blue dot) of the spectral shaper as a function of the wavelength are also included. (b) Comparison of the amplified spectrum with (red) and without (black) spectral shaping. The spectra correspond to the output power of ∼ 15.5 W
Fig. 3. Measured output beam profiles from (a) the Yb:CALGO regenerative amplifier and (b) the cascaded-quadratic compressor.
Fig. 4. SHG-FROG measurement of the 95 fs pulses from the regenerative amplifier. The (a) measured and (b) retrieved FROG traces of the 95 fs pulse. The FROG error is 0.8%. (c) The retrieved temporal profile and the transform-limited temporal profile. (d) The retrieved FROG spectral intensity and phase of the 95 fs laser pulse, compared to the spectrum independently measured using a spectral analyzer.
Fig. 5. SHG-FROG measurement of the 50 fs pulses from the cascaded-quadratic compressor. The (a) measured and (b) retrieved FROG traces of the 50 fs pulse. The FROG error is 0.95%. (c) The retrieved temporal profile and the transform-limited temporal profile. (d) The retrieved FROG spectral intensity and phase of the 50 fs laser pulse, compared to the spectrum independently measured using a spectral analyzer.
Fig. 6. (a) Measured spectra of driving pulses plotted in logarithmic scale from the regenerative amplifier (black), after the BBO cascaded-quadratic compressor (red), and after the 8 mm thick LGS crystal (blue). (b) The measured MIR spectra with different phase-matching angles tuning in the wavelength range of 7.5–11.2 μm.


Set citation alerts for the article
Please enter your email address

© Copyright 2018-2021 | Chinese Laser Press. All Rights Reserved 沪ICP备15018463号-20