Author Affiliations
1Nanyang Technological University, School of Physical and Mathematical Sciences, Division of Physics and Applied Physics, Singapore2MajuLab, International Joint Research Unit UMI 3654, CNRS, Université Côte d’Azur, Sorbonne Université, National University of Singapore, Nanyang Technological University, Singapore3Tsinghua University, State Key Laboratory of Low-Dimensional Quantum Physics, Department of Physics, Beijing, China4Beijing Academy of Quantum Information Sciences, Beijing, China5Tsinghua University, Beijing Innovation Center for Future Chips, Beijing, Chinashow less
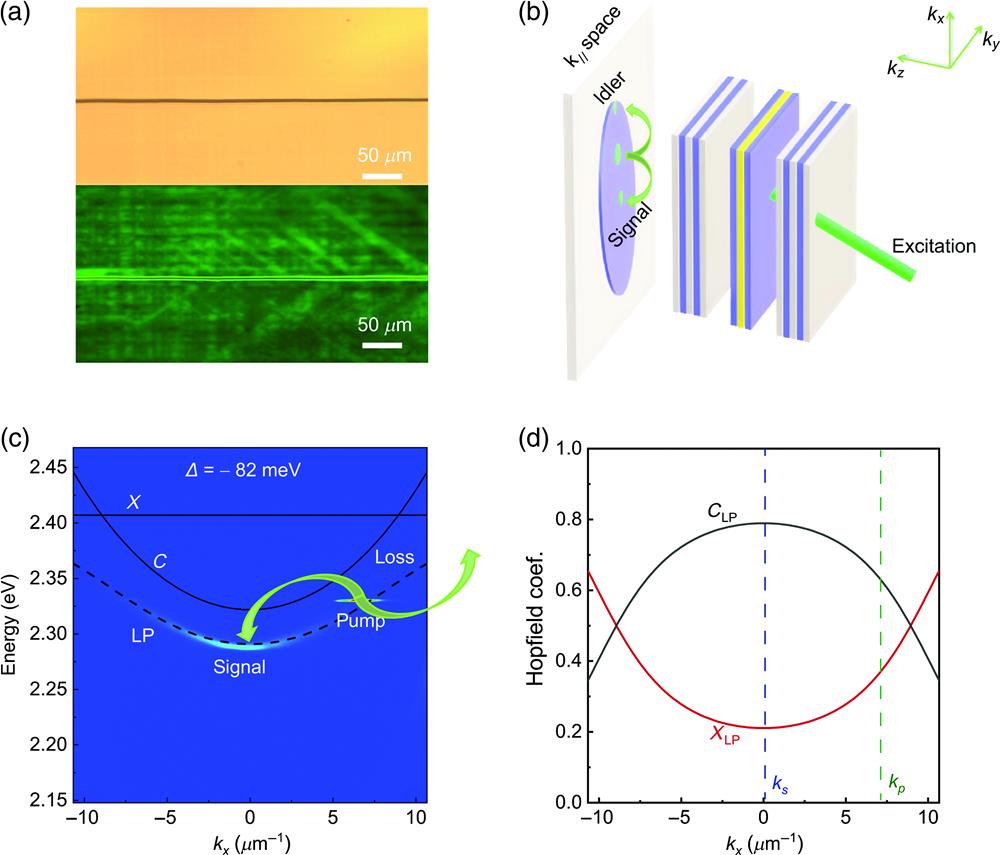
Fig. 1. Schematic diagram and mechanism of polariton parametric oscillator in the perovskite microcavity. (a) Microscopy image and fluorescence microscopy image of the perovskite single crystal. (b) Experimental geometry of the perovskite microcavity, in which a thick perovskite is sandwiched by two DBRs. (c) Angle-resolved photoluminescence spectrum of microcavity along polarization under CW excitations. The dashed black line displays the theoretical fitting dispersion of the LP dispersion; the solid black lines show the dispersions of uncoupled perovskite exciton () and cavity photon mode (); the detuning is indicated in this figure. (d) Hopfield coefficients illustrating the exciton () and photon () fraction of the LP dispersion along polarization; the blue vertical line denotes the signal state polariton (); the green vertical line represents the pump state polariton ().
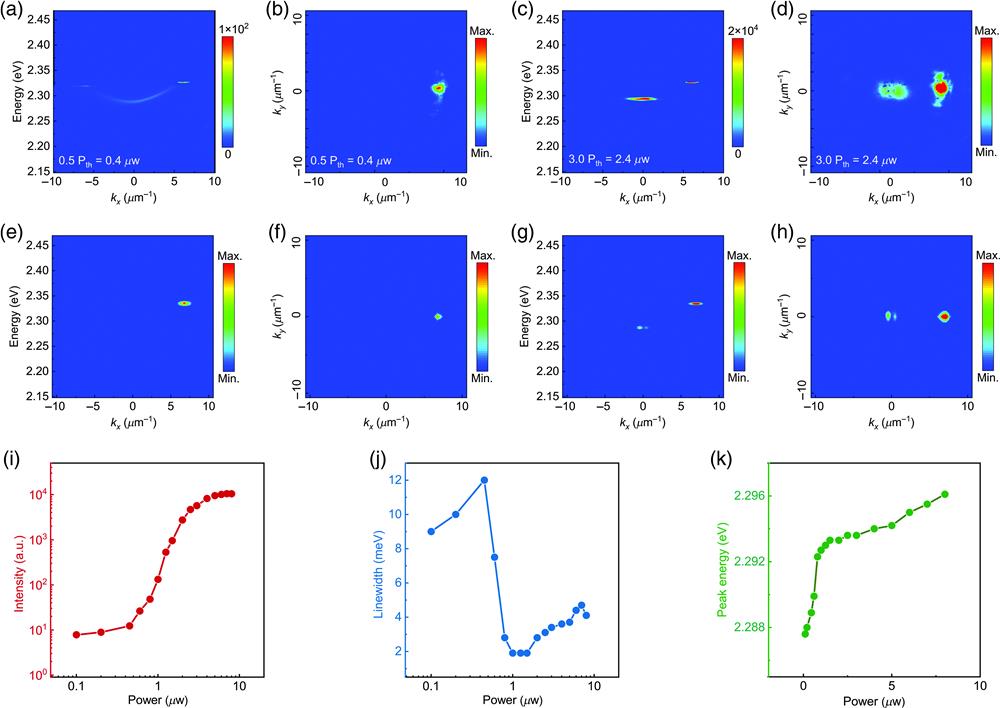
Fig. 2. Observation and characterizations of polariton oscillation at room temperature. Experimental far-field emission of (a) energy– and (b) - at the pump power of . Experimental far-field emission of (c) energy– and (d) - at the pump power of . Theoretically calculated far-field emission of (e) energy– and (f) - at the pump power of . Theoretically calculated far-field emission of (g) energy– and (h) - at the pump power of . (i) Signal-state emission intensity as a function of pump fluence in a log–log scale, demonstrating a super-linear increase by three orders of magnitude near threshold. (j) Signal-state emission linewidth as a function of pump fluence along with a sharp narrowing linewidth from 12 to 2 meV at the threshold. (k) Signal-state emission peak energy with a continuous blueshift trend.
Fig. 3. Characterizations of polariton oscillator versus pump states for three samples with different detunings , , , respectively. (a)–(c) The pump state is tuned with energy and angle to resonantly excite the LP dispersion for detunings (a) , (b) , and (c) . (d)–(f) The energy conversion threshold as a function of pump state angle for detunings (d) , (e) , and (f) . The lowest energy conversion threshold peaks at (d) , (e) , and (f) , respectively. The black circles denote the occurrence of OPO, whereas the red circles represent cases where the OPO was not present.
Fig. 4. Polarization dependence of the polariton parametric oscillator. (a) Angle-resolved photoluminescence spectrum of microcavity along polarization and polarization under CW excitation. (b) Polar plot of the polarized pump excited at (533 nm), centered (black circle dots), and fitting function (black solid line) . (c) Under excitation of (b), polar plot of the measured polarization emission of the signal state at , (red circle dots) and fitting function (red solid line) . (d) Polar plot of the left circularly polarized pump excited at (533 nm), centered (black circle dots), as well as a fitting constant function (continuous line). (e) Under excitation of (d), polar plot of the measured polarization emission of the signal state at , (red circle dots), and fitting function (red solid line) ; at , (blue circle dots), and fitting function (blue solid line) .