
Xinliang Zhang, Yanjing Zhao. Research Progress of Microresonator-Based Optical Frequency Combs[J]. Acta Optica Sinica, 2021, 41(8): 0823014
- Acta Optica Sinica
- Vol. 41, Issue 8, 0823014 (2021)
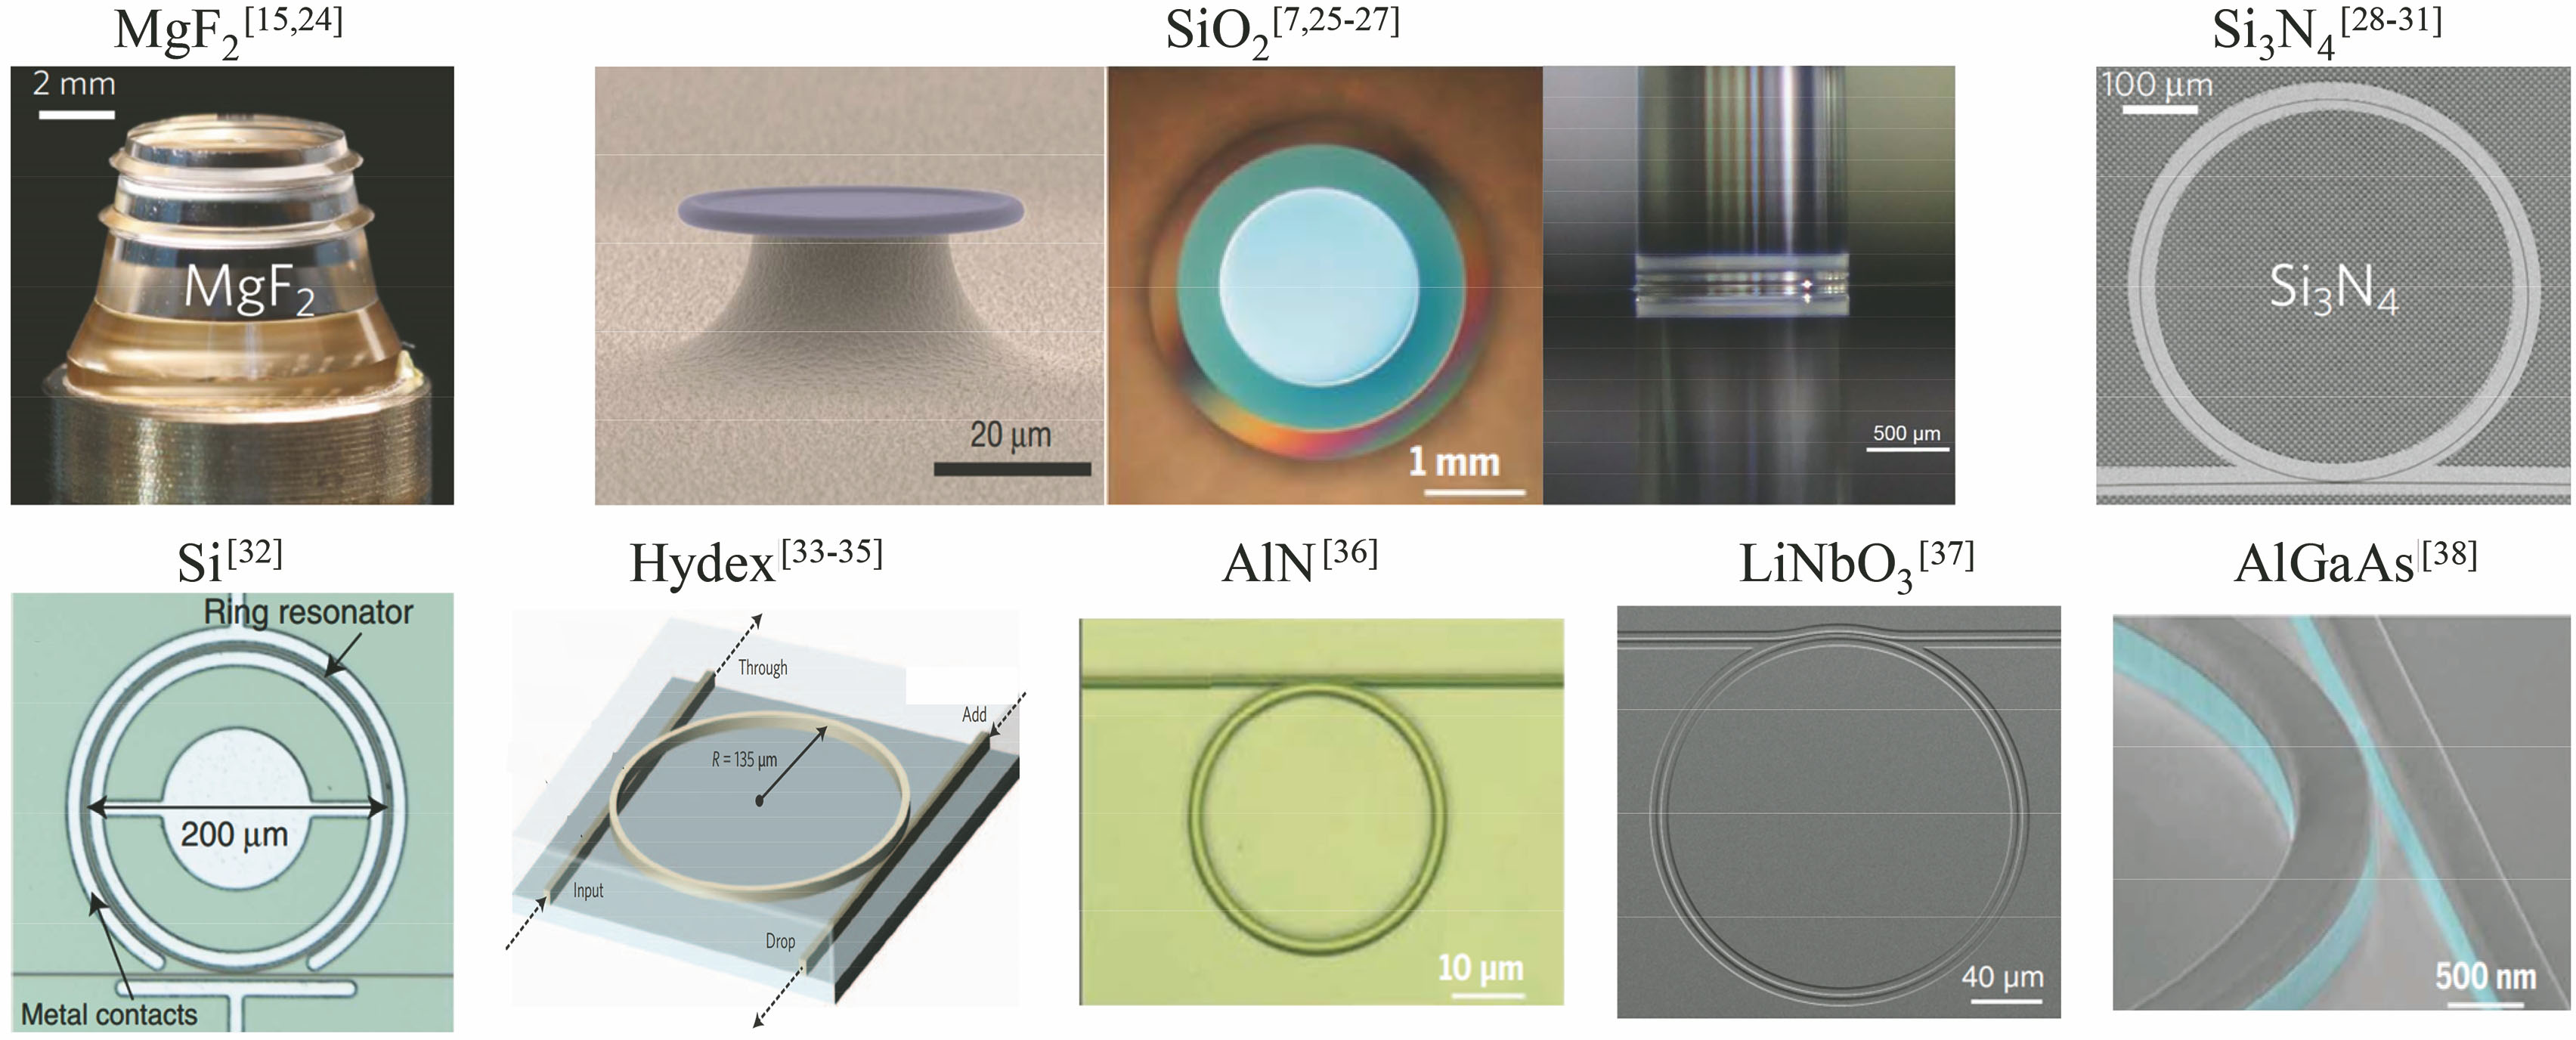
Fig. 1. Soliton microcavity optical frequency comb generation platforms
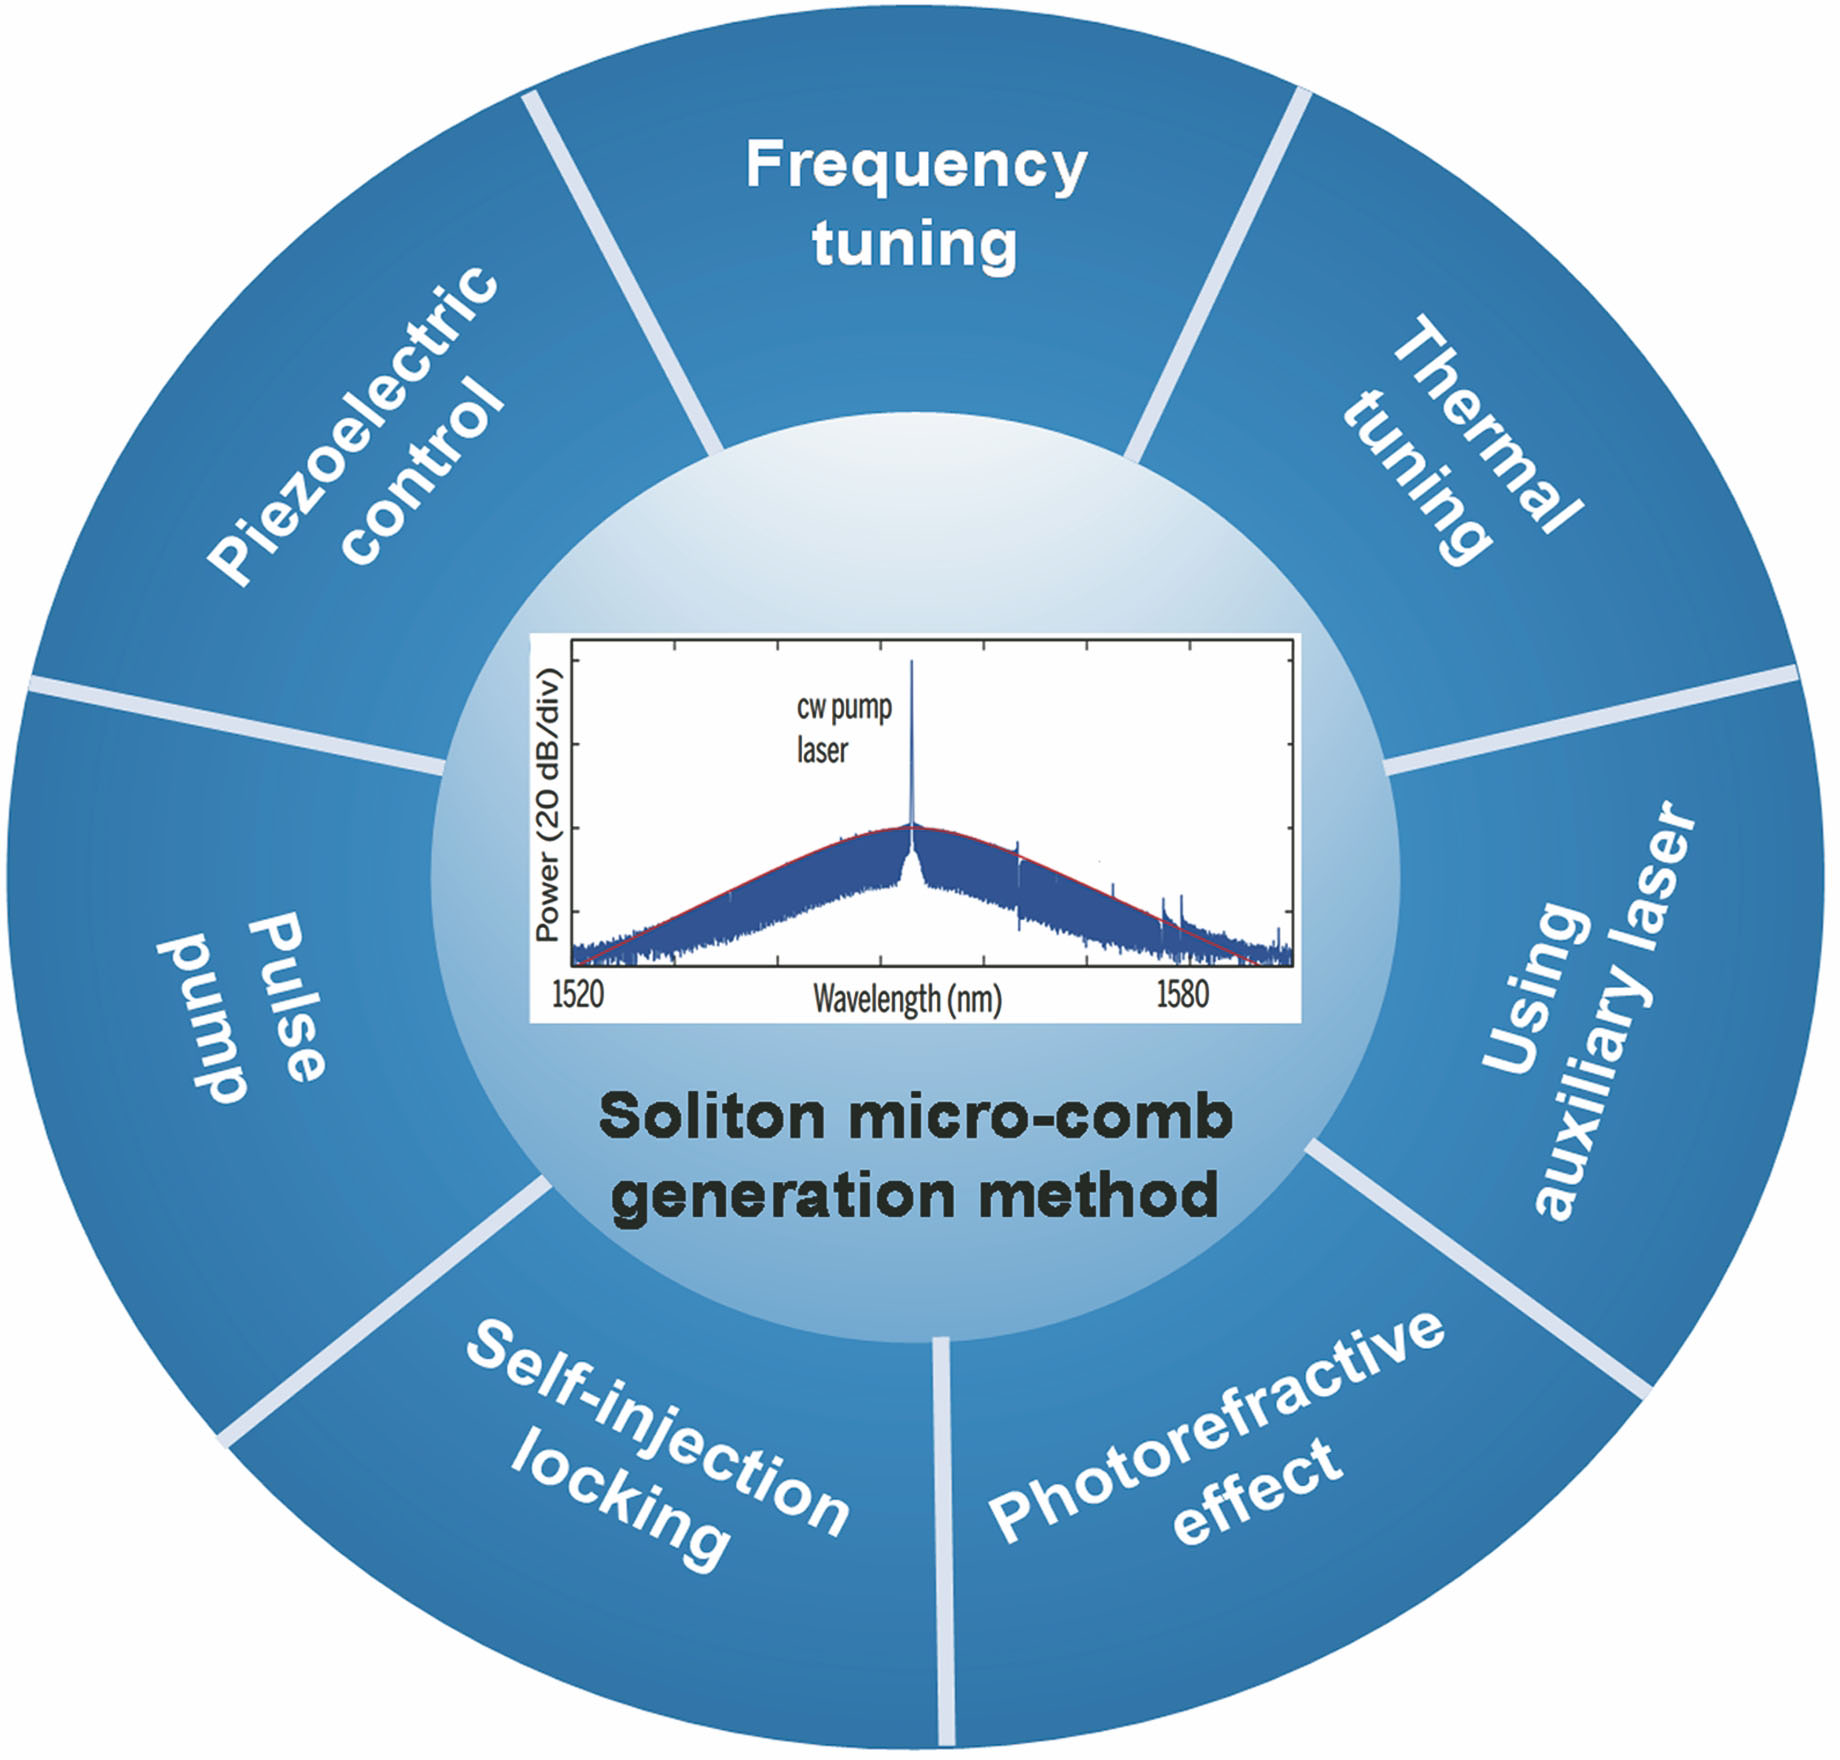
Fig. 2. Soliton microcavity optical frequency comb generation methods
Fig. 3. Frequency tuning scheme. (a) Experimental setup of frequency tuning scheme[15]; (b) transmission power curve of microcavity[15]; (c) microcavity optical frequency comb spectra of primary comb, sub-comb, and MI state[15]; (d) superposition of transmission power curves of microcavity corresponding to multiple forward tuning[31]; (e) transmission power curves of microcavity during forward and reverse tuning [31]; (f) spectrum of multi solitons[15]; (g) spectrum of one soliton, inset shows the radio frequency signal from beat frequency[15]
Fig. 4. Auxiliary photothermal compensation scheme[51]. (a) Principle of auxiliary photothermal compensation scheme, the arrows indicate the position of pump and auxiliary laser during the frequency tuning; (b) transmission power curves of pump light, auxiliary light, and generated microcavity comb
Fig. 5. Photorefractive effect[37]. (a) Transmission power curve of microcavity in reverse tuning process; (b) transmission power curve of microcavity in forward tuning process; (c) experimental results of soliton self starting and bidirectional conversion
Fig. 6. Physical mechanism of microcavity optical frequency comb
Fig. 7. Spectral characterizations of microcavity optical frequency comb. (a) Static spectra of primary comb, sub-comb, and MI state[15]; (b) static spectra of single-soliton, dual-soliton, and five-soliton[15]; (c) static spectrum of breather[69]; (d) intensity evolution of comb line at center and wing for breather[69]
Fig. 8. Temporal characterizations of microcavity optical frequency comb. (a) Measured results of autocorrelator[14]; (b) measured results of FROG method[80]; (c) measured result of dual-comb detection[81]; (d) measured results of temporal magnified system[83]
Fig. 9. RF spectral characterizations of microcavity optical frequency comb. (a) Low frequency noise measured by electric spectrum analyzer for single frequency pump, MI state and soliton state[14]; (b) fundamental frequency noise measured by electric spectrum analyzer for soliton state[15]; (c) RF spectrum measured by LISA system[35]; (d) harmonic evolution measured by LISA system for MI state and soliton state[85]
Fig. 10. Micro-comb applications

Set citation alerts for the article
Please enter your email address
© Copyright 2018-2021 | Chinese Laser Press. All Rights Reserved 沪ICP备15018463号-20