• Matter and Radiation at Extremes
  • Vol. 6, Issue 2, 025902 (2021)
V. T. Tikhonchuk1、2、a), T. Gong3, N. Jourdain1, O. Renner1、4, F. P. Condamine1, K. Q. Pan3, W. Nazarov5, L. Hudec6, J. Limpouch6, R. Liska6, M. Krůs4, F. Wang3, D. Yang3, S. W. Li3, Z. C. Li3, Z. Y. Guan3, Y. G. Liu3, T. Xu3, X. S. Peng3, X. M. Liu3, Y. L. Li3, J. Li3, T. M. Song3, J. M. Yang3, S. E. Jiang3, B. H. Zhang3, W. Y. Huo7, G. Ren7, Y. H. Chen7, W. Zheng7, Y. K. Ding7, K. Lan7、8, and S. Weber1、9
Author Affiliations
  • 1ELI-Beamlines, Institute of Physics, Czech Academy of Sciences, 25241 Dolní Břežany, Czech Republic
  • 2Centre Lasers Intenses et Applications, University of Bordeaux–CNRS–CEA, 33405 Talence, France
  • 3Laser Fusion Research Center, China Academy of Engineering Physics, Mianyang 621900, China
  • 4Institute of Plasma Physics, Czech Academy of Sciences, 18200 Prague, Czech Republic
  • 5Independent Foam Target Supplier, Carnoustie, DD7 6DP, United Kingdom
  • 6Faculty of Nuclear Sciences and Physical Engineering, Czech Technical University in Prague, 11519 Prague, Czech Republic
  • 7Institute of Applied Physics and Computational Mathematics, Beijing 100088, China
  • 8Center for Applied Physics and Technology, Peking University, Beijing 100871, China
  • 9School of Science, Xi’an Jiaotong University, Xi’an 710049, China
  • show less
    DOI: 10.1063/5.0023006 Cite this Article
    V. T. Tikhonchuk, T. Gong, N. Jourdain, O. Renner, F. P. Condamine, K. Q. Pan, W. Nazarov, L. Hudec, J. Limpouch, R. Liska, M. Krůs, F. Wang, D. Yang, S. W. Li, Z. C. Li, Z. Y. Guan, Y. G. Liu, T. Xu, X. S. Peng, X. M. Liu, Y. L. Li, J. Li, T. M. Song, J. M. Yang, S. E. Jiang, B. H. Zhang, W. Y. Huo, G. Ren, Y. H. Chen, W. Zheng, Y. K. Ding, K. Lan, S. Weber. Studies of laser-plasma interaction physics with low-density targets for direct-drive inertial confinement fusion on the Shenguang III prototype[J]. Matter and Radiation at Extremes, 2021, 6(2): 025902 Copy Citation Text show less
    Time dependence of the ionization front position in hydrodynamic simulations of the target considered as a homogeneous material of density 10 mg/cm3 (1) and 12 mg/cm3 (2) and with a model29 accounting for the foam homogenization with foam density 10 mg/cm3 (3) and 12 mg/cm3 (4). The yellow background shows the temporal profile of the laser pulse power. The laser propagates in the negative z direction, and the foil edge is at z = 0.
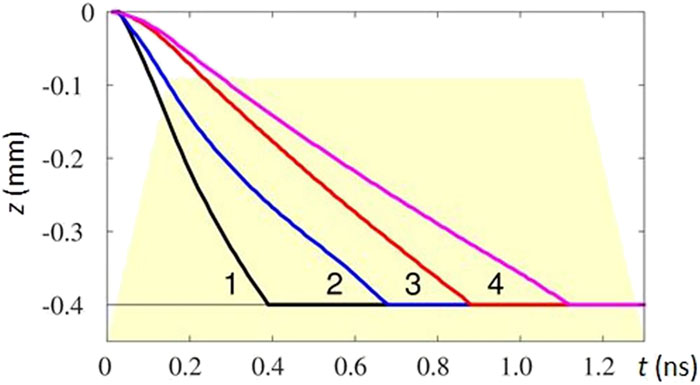
    Fig. 1. Time dependence of the ionization front position in hydrodynamic simulations of the target considered as a homogeneous material of density 10 mg/cm3 (1) and 12 mg/cm3 (2) and with a model29 accounting for the foam homogenization with foam density 10 mg/cm3 (3) and 12 mg/cm3 (4). The yellow background shows the temporal profile of the laser pulse power. The laser propagates in the negative z direction, and the foil edge is at z = 0.
    Spatial profiles of plasma electron temperature (a), density (b), and flow velocity (c) at four time moments of 0.25 ns (solid blue), 0.5 ns (dashed blue), 0.75 ns (dotted blue), and 1 ns (solid red) calculated using the PALE code for a foam density of 10 mg/cm3. The laser propagates in the negative z direction, and the foil edge is at z = 0.
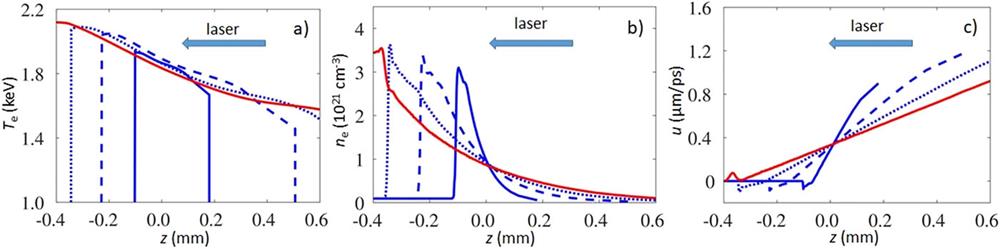
    Fig. 2. Spatial profiles of plasma electron temperature (a), density (b), and flow velocity (c) at four time moments of 0.25 ns (solid blue), 0.5 ns (dashed blue), 0.75 ns (dotted blue), and 1 ns (solid red) calculated using the PALE code for a foam density of 10 mg/cm3. The laser propagates in the negative z direction, and the foil edge is at z = 0.
    Temporal dependence of the fraction of scattered light (blue) obtained in the PALE simulation for a foam density of 10 mg/cm2, with the heating laser beams (red) and with the interaction laser beam (black) delayed by 0.5 ns (a) and 1 ns (b). All pulses are normalized to unity.
    Fig. 3. Temporal dependence of the fraction of scattered light (blue) obtained in the PALE simulation for a foam density of 10 mg/cm2, with the heating laser beams (red) and with the interaction laser beam (black) delayed by 0.5 ns (a) and 1 ns (b). All pulses are normalized to unity.
    Overall experimental setup seen from the top (a) and the side (b). Red arrows indicate the direction of incidence of the heating beams S1–S4, and green arrows indicate the direction of the interaction beam N2. The target and the washer are in the target chamber center. The positions of the electron spectrometers (ES) are indicated by letters A, B, D, E, and F. Also shown are the positions of the crystal and a cassette with image plates (IP) for the Kα detection.
    Fig. 4. Overall experimental setup seen from the top (a) and the side (b). Red arrows indicate the direction of incidence of the heating beams S1–S4, and green arrows indicate the direction of the interaction beam N2. The target and the washer are in the target chamber center. The positions of the electron spectrometers (ES) are indicated by letters A, B, D, E, and F. Also shown are the positions of the crystal and a cassette with image plates (IP) for the Kα detection.
    Scheme of overlapping of the heating and interaction beams in the foam target. The heating beams S1 and S2 and the interaction beam N2 come from the top and the heating beams S3 and S4 from the bottom. All beams are directed at an angle of 45° with respect to the target normal. The beams S1 and S2 are focused 150 µm above the target center, the beam N2 is focused at the center, and the beams S3 and S4 are focused 150 µm below the target center.
    Fig. 5. Scheme of overlapping of the heating and interaction beams in the foam target. The heating beams S1 and S2 and the interaction beam N2 come from the top and the heating beams S3 and S4 from the bottom. All beams are directed at an angle of 45° with respect to the target normal. The beams S1 and S2 are focused 150 µm above the target center, the beam N2 is focused at the center, and the beams S3 and S4 are focused 150 µm below the target center.
    Footprints of the heating beams and the interaction beam N2: (a) at the top of the foam target, 400 µm from the target center; (b) at the target center; (c) at the bottom, −400 µm from the target center. The blue dashed circles of radius 500 µm are drawn for reference. (d) Photograph of the foam target (white), washer, and holder as used in the experiment.
    Fig. 6. Footprints of the heating beams and the interaction beam N2: (a) at the top of the foam target, 400 µm from the target center; (b) at the target center; (c) at the bottom, −400 µm from the target center. The blue dashed circles of radius 500 µm are drawn for reference. (d) Photograph of the foam target (white), washer, and holder as used in the experiment.
    (a) Spectrum of soft x-ray plasma emission obtained with the SXS diagnostic in three consecutive shots: 338 (blue), 339 (red), and 340 (black). Peaks at 367 eV, 653 eV, and 1400 eV correspond to the emission of carbon, oxygen, and copper ions at a plasma temperature of 1.8 keV. (b) Streaked image of plasma observed with the XSC diagnostic in soft x rays in the equatorial plane through the washer slit in shot 338. The x axis in the image corresponds to the target normal direction, with the point x = 0 corresponding to the target center. (c) Streaked image of plasma obtained with XSC in shot 341, where the heating beams S3 and S4 coming from the right were disabled. The orange dashed lines show the putative positions of the ionization front (right) and the expanding plasma (left).
    Fig. 7. (a) Spectrum of soft x-ray plasma emission obtained with the SXS diagnostic in three consecutive shots: 338 (blue), 339 (red), and 340 (black). Peaks at 367 eV, 653 eV, and 1400 eV correspond to the emission of carbon, oxygen, and copper ions at a plasma temperature of 1.8 keV. (b) Streaked image of plasma observed with the XSC diagnostic in soft x rays in the equatorial plane through the washer slit in shot 338. The x axis in the image corresponds to the target normal direction, with the point x = 0 corresponding to the target center. (c) Streaked image of plasma obtained with XSC in shot 341, where the heating beams S3 and S4 coming from the right were disabled. The orange dashed lines show the putative positions of the ionization front (right) and the expanding plasma (left).
    Hard x-ray pinhole images recorded with XPHC1 [(a) and (b)] and XPHC2 (c) in shots 341 (a) and 342 [(b) and (c)]. The orientation of (a) and (b) is the same as in Fig. 6(a) (the interaction beam N2 comes from the right). In shot 341, the heating beams S3 and S4 were disabled. The blue circles of diameter 1 mm are drawn for reference.
    Fig. 8. Hard x-ray pinhole images recorded with XPHC1 [(a) and (b)] and XPHC2 (c) in shots 341 (a) and 342 [(b) and (c)]. The orientation of (a) and (b) is the same as in Fig. 6(a) (the interaction beam N2 comes from the right). In shot 341, the heating beams S3 and S4 were disabled. The blue circles of diameter 1 mm are drawn for reference.
    (a) Time-resolved spectrum of laser light scattered in the N2 FABS near the laser frequency in shot 337. The white and green curves show the time dependence of intensity and the time-integrated spectrum. (b) Time-integrated spectra near the laser wavelength recorded by the N2 FABS station for shots 334 (blue), 335 (red), 336 (black), and 337 (green). In shots 334, 336, and 337, the interaction beam N2 was delayed by 0.5 ns and SSD was turned off; in shot 335, the N2 beam was not activated. The foam density is 10 mg/cm3 in shots 334 and 335, and 12 mg/cm3 in shots 336 and 337.
    Fig. 9. (a) Time-resolved spectrum of laser light scattered in the N2 FABS near the laser frequency in shot 337. The white and green curves show the time dependence of intensity and the time-integrated spectrum. (b) Time-integrated spectra near the laser wavelength recorded by the N2 FABS station for shots 334 (blue), 335 (red), 336 (black), and 337 (green). In shots 334, 336, and 337, the interaction beam N2 was delayed by 0.5 ns and SSD was turned off; in shot 335, the N2 beam was not activated. The foam density is 10 mg/cm3 in shots 334 and 335, and 12 mg/cm3 in shots 336 and 337.
    (a) Temporal profiles of the heating laser beam S1 (red) and the backward-scattered signal (blue and green, in the SBS and SRS channels, respectively) recorded in shot 335 with only four heating beams activated. (b) Temporal profiles of the heating S1 beam (red), the interaction beam N2 (black, delayed by 1 ns), backward-scattered light near the laser frequency (blue), and backward-scattered SRS signal (green) recorded in the 339. All signals were recorded by the N2 FABS station.
    Fig. 10. (a) Temporal profiles of the heating laser beam S1 (red) and the backward-scattered signal (blue and green, in the SBS and SRS channels, respectively) recorded in shot 335 with only four heating beams activated. (b) Temporal profiles of the heating S1 beam (red), the interaction beam N2 (black, delayed by 1 ns), backward-scattered light near the laser frequency (blue), and backward-scattered SRS signal (green) recorded in the 339. All signals were recorded by the N2 FABS station.
    (a) Time-resolved SRS spectrum of laser light scattered in the N2 FABS below the laser frequency for shot 338. The white and green curves show the time dependence of intensity and the time-integrated spectrum. (b) Time-integrated SRS spectra recorded by the N2 FABS station for shots 338 (blue), 339 (red), 340 (black), 341 (pink), 342 (green), and 344 (cyan). The interaction beam N2 was delayed by 1 ns in all shots, and SSD was turned off in shots 338, 342, and 344. The foam density is 10 mg/cm3 in shots 338, 339, and 344, and 12 mg/cm3 in shots 340, 341, and 342. The depressions in the spectra around 530 nm are due to the interference filter suppressing the second harmonic of laser radiation.
    Fig. 11. (a) Time-resolved SRS spectrum of laser light scattered in the N2 FABS below the laser frequency for shot 338. The white and green curves show the time dependence of intensity and the time-integrated spectrum. (b) Time-integrated SRS spectra recorded by the N2 FABS station for shots 338 (blue), 339 (red), 340 (black), 341 (pink), 342 (green), and 344 (cyan). The interaction beam N2 was delayed by 1 ns in all shots, and SSD was turned off in shots 338, 342, and 344. The foam density is 10 mg/cm3 in shots 338, 339, and 344, and 12 mg/cm3 in shots 340, 341, and 342. The depressions in the spectra around 530 nm are due to the interference filter suppressing the second harmonic of laser radiation.
    (a) Time-integrated Kα image. The distance between bright spots is ∼0.8 mm. The yellow zone shows the projection of the interaction beam. (b) Hot-electron energy distribution measured with the electron spectrometer in the same shot 337 (black). The dashed red curve shows the interpolation with an exponential function corresponding to a temperature of 22 keV.
    Fig. 12. (a) Time-integrated Kα image. The distance between bright spots is ∼0.8 mm. The yellow zone shows the projection of the interaction beam. (b) Hot-electron energy distribution measured with the electron spectrometer in the same shot 337 (black). The dashed red curve shows the interpolation with an exponential function corresponding to a temperature of 22 keV.
    Shot no.Density (mg/cm3)Laser energy (J)Delay (ns)SSD On N2N2 SBS (%)N2 SRS (%)S1 FABS (%)Kα (109 photons)
    S1S2S3S4N2TotalFABSNBSFABSNBSSBSSRSTopBottom
    3341079589176180672239750.5Off4.58.511.59.20.7
    335101026982757807035720007.92.4
    3361283786181086881641920.5Off5.45.911.88.50.4
    3371295783877176975440890.5Off9.112.22.416.415.21.452.42
    3381088991278180480141871.0Off4.45.95.428.516.40.130.27
    3391065575177884469837261.0On4.13.92.220.38.60.260.13
    3401291691272975479041011.0On5.73.52.521.213.20.240.38
    341128008470082024671.0On6.00.32.720.612.0
    3421293087376273791042121.0Off8.7−0.94.217.614.111.69.5
    3431286987076875303260000013.00.220.27
    3441086879277077291341151.0Off3.14.0025.012.4
    Table 1. Characteristics of the laser beams and targets in each shot along with measured optical and x-ray signals. The values in columns N2 show the SBS and SRS signals from the N2 beam only. The energy of a parasitic specular light measured by the N2 FABS station is subtracted from these data. Original data are shown in Table II in the Appendix.
    V. T. Tikhonchuk, T. Gong, N. Jourdain, O. Renner, F. P. Condamine, K. Q. Pan, W. Nazarov, L. Hudec, J. Limpouch, R. Liska, M. Krůs, F. Wang, D. Yang, S. W. Li, Z. C. Li, Z. Y. Guan, Y. G. Liu, T. Xu, X. S. Peng, X. M. Liu, Y. L. Li, J. Li, T. M. Song, J. M. Yang, S. E. Jiang, B. H. Zhang, W. Y. Huo, G. Ren, Y. H. Chen, W. Zheng, Y. K. Ding, K. Lan, S. Weber. Studies of laser-plasma interaction physics with low-density targets for direct-drive inertial confinement fusion on the Shenguang III prototype[J]. Matter and Radiation at Extremes, 2021, 6(2): 025902
    Download Citation