
V. T. Tikhonchuk, T. Gong, N. Jourdain, O. Renner, F. P. Condamine, K. Q. Pan, W. Nazarov, L. Hudec, J. Limpouch, R. Liska, M. Krůs, F. Wang, D. Yang, S. W. Li, Z. C. Li, Z. Y. Guan, Y. G. Liu, T. Xu, X. S. Peng, X. M. Liu, Y. L. Li, J. Li, T. M. Song, J. M. Yang, S. E. Jiang, B. H. Zhang, W. Y. Huo, G. Ren, Y. H. Chen, W. Zheng, Y. K. Ding, K. Lan, S. Weber. Studies of laser-plasma interaction physics with low-density targets for direct-drive inertial confinement fusion on the Shenguang III prototype[J]. Matter and Radiation at Extremes, 2021, 6(2): 025902
- Matter and Radiation at Extremes
- Vol. 6, Issue 2, 025902 (2021)
Abstract
I. INTRODUCTION
A comprehensive understanding of parametric instabilities and the possibility of controlling them in the context of inertial confinement fusion (ICF) remains a challenging task. The details of the absorption processes and the detrimental effects of hot electrons on the implosion process are of great importance for both direct and indirect implosion schemes. At the moment, there are no reliable methods of controlling parametric instabilities and there is a serious risk of their adverse effects preventing ignition conditions from being reached. There is a clear need for more experimental studies supported by theoretical analysis and simulations. Here, we present results of studies of the excitation of parametric instabilities and generation of hot electrons in an underdense preformed plasma under conditions relevant to ICF implosion experiments with spatial scales of 300 µm or more and electron temperatures in the region of 2 keV. The experiments are performed on the Shenguang III prototype (SGIII-P) laser facility delivering about 8 kJ energy at a wavelength of 0.35 µm and a pulse duration of a few nanoseconds.
A large number of experiments have been performed on different laser facilities at a sub-kilojoule energy level, but they have involved smaller characteristic plasma lengths and lower temperatures.
Several experiments have already been conducted at the multi-kilojoule laser energy level
In the present paper, we report on an experiment dedicated to studies of laser-plasma interaction under conditions relevant to ICF with low-density foam targets. The preliminary experimental design has been described in Ref.
The remainder of the article is organized as follows. Numerical simulations of plasma formation from a foam under the experimental conditions are presented in Sec.
II. NUMERICAL MODELING OF LASER-PLASMA INTERACTION
A. Interaction conditions
We aim for studies of laser-plasma interactions under conditions relevant to ICF. A large-scale (Ln ∼ 300 µm), underdense (ne ∼ 0.2ncr), and hot (Te ∼ 2 keV) plasma was created with four laser beams delivering a total energy of 3.2 kJ in 1 ns at the third harmonic (λ = 0.351 µm) of a Nd:glass laser. Here, Ln is the plasma density scale length, ne and Te are the electron density and temperature, λ is the laser wavelength, and ncr = 9.05 × 1021 cm−3 is the corresponding critical density. Four laser beams irradiated from two sides a foam target of average density 10 mg/cm3–12 mg/cm3 and thickness 0.8 mm, and then, with a time delay of 0.5 ns or 1 ns, an interaction laser beam at the same wavelength and with intensity close to 1015 W/cm2 was used for the interaction studies.
B. Hydrodynamic simulations
Plasma formation was simulated using radiation hydrodynamic codes with the goal of defining the optimal interaction conditions, that is, creation of a sufficiently homogeneous plasma with required density and temperature.
The experiment is three-dimensional, and it cannot be fully simulated using the available hydrodynamic codes accounting for the laser-plasma interaction and foam structure. Consequently, the numerical simulations were performed in two steps. First, interaction of heating beams with the target was simulated using the two-dimensional (2D) axisymmetric Eulerian radiation hydrodynamic code XRL2D,
XRL2D is a 2D Eulerian radiation hydrodynamic code for studying laser interactions with solid-density targets. The electron and ion energy equations are solved with Kershaw’s nine-point diffusion difference scheme, and the electron heat flux is determined by the flux-limited diffusion model. The radiation transfer equation is solved by the flux-limited multigroup diffusion method. The laser energy deposition via inverse bremsstrahlung is calculated with a 3D ray-tracing package. The thermodynamic quantities are derived either from the ideal gas model or from data on the realistic equation of state. The mean opacity is calculated with the relativistic self-consistent average atom model OPINCH,
In the XRL2D simulations, two laser beams incident on a target from one side at an angle of 45° were modeled using a cone of opening angle of 45° with respect to the target normal and at a realistic power, and the target was modeled as a homogeneous material of equivalent density. Such a simulation describes the delivered laser energy correctly, but unfortunately does not account for the foam homogenization and thus overestimates the plasma temperature and ionization front velocity.
![]()
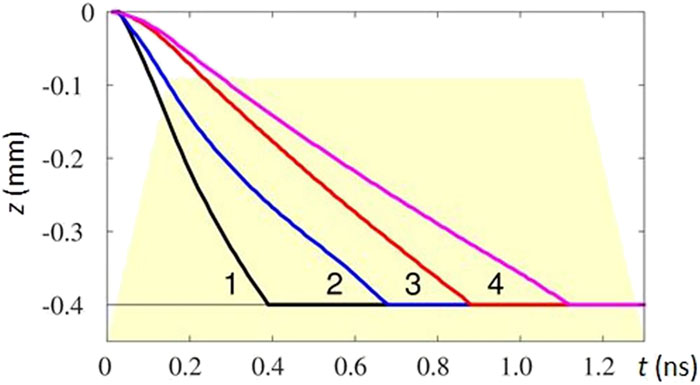
Figure 1.Time dependence of the ionization front position in hydrodynamic simulations of the target considered as a homogeneous material of density 10 mg/cm3 (1) and 12 mg/cm3 (2) and with a model
The propagation of an ionization front in a foam is delayed because of the time needed for dense elements in the foam to expand under the heat flux delivered by the laser beam, electrons, or radiation. Depending on the foam density and the laser intensity and wavelength, the ionization may propagate as a fast supersonic ionization wave or as a blast hydrodynamic wave including density compression beyond the front. Among the different numerical descriptions of foam homogenization,
PALE
A degree of foam homogenization
The results of the simulations for foam densities of 10 mg/cm3 and 12 mg/cm3 are shown in
The numerical simulation with the PALE code was used for defining the plasma hydrodynamic parameters of the expanding hot plasma and characterization of the parametric instabilities. The plasma characteristics along the symmetry axis for the foam density of 10 mg/cm3 are shown in
![]()
Figure 2.Spatial profiles of plasma electron temperature (a), density (b), and flow velocity (c) at four time moments of 0.25 ns (solid blue), 0.5 ns (dashed blue), 0.75 ns (dotted blue), and 1 ns (solid red) calculated using the PALE code for a foam density of 10 mg/cm3. The laser propagates in the negative
The electron density profile shown in
The temporal dependence of the scattered light calculated using PALE is shown in
![]()
Figure 3.Temporal dependence of the fraction of scattered light (blue) obtained in the PALE simulation for a foam density of 10 mg/cm2, with the heating laser beams (red) and with the interaction laser beam (black) delayed by 0.5 ns (a) and 1 ns (b). All pulses are normalized to unity.
III. EXPERIMENTAL SETUP AND DIAGNOSTICS
A. Experimental setup and targets
The overall scheme of the experimental setup and plasma diagnostics is shown in
![]()
Figure 4.Overall experimental setup seen from the top (a) and the side (b). Red arrows indicate the direction of incidence of the heating beams S1–S4, and green arrows indicate the direction of the interaction beam N2. The target and the washer are in the target chamber center. The positions of the electron spectrometers (ES) are indicated by letters A, B, D, E, and F. Also shown are the positions of the crystal and a cassette with image plates (IP) for the K
![]()
Figure 5.Scheme of overlapping of the heating and interaction beams in the foam target. The heating beams S1 and S2 and the interaction beam N2 come from the top and the heating beams S3 and S4 from the bottom. All beams are directed at an angle of 45° with respect to the target normal. The beams S1 and S2 are focused 150
All laser beams were smoothed spatially with continuous phase plates and temporally by spectral dispersion (SSD). The laser pulse spectral width at the wavelength of 351 nm was 0.02 Å without SSD and 1 Å with SSD. Temporal smoothing was switched off for the interaction beam N2 in several shots, with the goal of evaluating the role of high-intensity speckles in the excitation of parametric instabilities.
As shown in
![]()
Figure 6.Footprints of the heating beams and the interaction beam N2: (a) at the top of the foam target, 400
The targets were made of a foam with a density of 10 mg/cm3 or 12 mg/cm3 and a pore size of ∼1 µm and were doped with copper nanoparticles at a mass fraction of 1% for diagnostic purposes. The foam chemical formula C15H20O6 corresponds to a maximum electron density of 3.2 × 1021 cm−3 (for the foam mass density of 10 mg/cm3) with ions having average charge Z = 3.85 and average atomic mass A = 7.2. This density is approximately one-third of the critical density, which is ncr = 9.05 × 1021 cm−3 for a laser wavelength of 0.351 µm. The foam of diameter 2 mm was supported by a washer of diameter 8 mm with a 1.2 mm window for x-ray diagnostics, as shown in
While the quarter critical density was produced near the ionization front, numerical simulations presented in Sec.
B. Diagnostics
Scattered light from the plasma was measured with two full-aperture backscattering (FABS) stations installed on the beams S1 and N2, and with a near-backward-scattering (NBS) station installed on the beam N2. The FABS measured signals in two spectral domains, near the main laser wavelength (denoted by SBS) and downshifted (denoted by SRS), within the laser beam focusing aperture of ∼0.03 sr, with temporal resolution better than 100 ps and spectral resolution better than 0.1 nm in the SBS channel and better than 10 nm in the SRS channel.
The NBS station collected the light scattered outside the laser focusing cone within a solid angle of 0.30 sr. The scattered light was collected by a hollowed off-axis ellipsoidal mirror and then separated into two channels by a beam splitter for SBS and SRS measurements, respectively. In the SBS channel, the detectable wavelength was in the range 351 ± 2 nm; in the SRS channel, the detectable wavelengths ranged from 400 nm to 700 nm. In each channel, the scattered light was recorded by an energy meter, without temporal resolution.
The x-ray diagnostics were operated in the hard and soft spectral ranges. Their position with respect to the target laser beams is shown in
A soft x-ray spectrometer (SXS) measured the spectrum of soft emission of the plasma at an angle of 20° from the target normal in the upper hemisphere. Soft x rays were measured by 15 channels, which covered the energy range from 125 eV to 4000 eV with a resolution ranging from 40 eV to 50 eV at the bottom edge to 100 eV–200 eV at the top edge. This setup has a better resolution in the energy range below 1000 eV and a poorer resolution above 1000 eV. The x-ray spectra were obtained by iterative fitting of the signals recorded by the 15 channels and by comparison with the theoretically predicted spectra.
An x-ray streak camera (XSC) provided a time-resolved plasma image in the normal to the target direction. It observed the plasma in soft x rays with a temporal resolution better than 50 ps through the window in the washer as shown in
Target self-emission was also measured using two x-ray pin-hole cameras (XPHCs) recording plasma emission in the energy range above 2 keV. One camera (XPHC1) was positioned in the upper hemisphere at an angle of 20° from the target normal, and the other (XPHC2) saw the target from the lower hemisphere at an angle of 45° with respect to the equatorial plane. XPHC1 was operated in all shots and provided the major information, whereas XPHC2 was operated only in five shots and provided complementary information.
Electron emission outside the targets was monitored by several compact spectrometers (ES) based on fast electron deflection in a magnetic field. In each of these spectrometers, electrons transmitted through an aperture with a diameter of 1 mm drilled in a thick Murytal plastic are affected by a transverse field between steel poles attached to permanent magnets. The optimum distance of the entrance aperture from the target is 300 mm but the construction of spectrometers is flexible enough to guarantee reliable operation at an arbitrary angle and distance from the target. The energy range covered by each spectrometer spans from 55 keV to 1.5 MeV. This energy range is much larger than the plasma potential, which is comparable to the bulk electron temperature and cannot be more than a few keV in our experiment. The trajectories of electrons in the magnetic field are traced using the SIMION code,
In the experiment, five electron spectrometers were employed. They were positioned at a distance of 30 cm from the target and observed the plasma from the left hemisphere at an angle of 45° with respect to the equatorial plane and at angles of 65°–80° with respect to the propagation direction of the interaction beam. The solid angle of detection was 10−5 sr.
IV. EXPERIMENTAL RESULTS AND QUALITATIVE ANALYSIS
The parameters of the laser beams and targets as well as the overall results obtained with optical and x-ray diagnostics are presented in
| Shot no. | Density (mg/cm3) | Laser energy (J) | Delay (ns) | SSD On N2 | N2 SBS (%) | N2 SRS (%) | S1 FABS (%) | Kα (109 photons) | |||||||||
|---|---|---|---|---|---|---|---|---|---|---|---|---|---|---|---|---|---|
| S1 | S2 | S3 | S4 | N2 | Total | FABS | NBS | FABS | NBS | SBS | SRS | Top | Bottom | ||||
| 334 | 10 | 795 | 891 | 761 | 806 | 722 | 3975 | 0.5 | Off | 4.5 | 8.5 | … | 11.5 | 9.2 | 0.7 | … | … |
| 335 | 10 | 1026 | 982 | 757 | 807 | 0 | 3572 | … | … | 0 | 0 | … | 0 | 7.9 | 2.4 | … | … |
| 336 | 12 | 837 | 861 | 810 | 868 | 816 | 4192 | 0.5 | Off | 5.4 | 5.9 | … | 11.8 | 8.5 | 0.4 | … | … |
| 337 | 12 | 957 | 838 | 771 | 769 | 754 | 4089 | 0.5 | Off | 9.1 | 12.2 | 2.4 | 16.4 | 15.2 | … | 1.45 | 2.42 |
| 338 | 10 | 889 | 912 | 781 | 804 | 801 | 4187 | 1.0 | Off | 4.4 | 5.9 | 5.4 | 28.5 | 16.4 | … | 0.13 | 0.27 |
| 339 | 10 | 655 | 751 | 778 | 844 | 698 | 3726 | 1.0 | On | 4.1 | 3.9 | 2.2 | 20.3 | 8.6 | … | 0.26 | 0.13 |
| 340 | 12 | 916 | 912 | 729 | 754 | 790 | 4101 | 1.0 | On | 5.7 | 3.5 | 2.5 | 21.2 | 13.2 | … | 0.24 | 0.38 |
| 341 | 12 | 800 | 847 | 0 | 0 | 820 | 2467 | 1.0 | On | 6.0 | 0.3 | 2.7 | 20.6 | 12.0 | … | … | … |
| 342 | 12 | 930 | 873 | 762 | 737 | 910 | 4212 | 1.0 | Off | 8.7 | −0.9 | 4.2 | 17.6 | 14.1 | … | 11.6 | 9.5 |
| 343 | 12 | 869 | 870 | 768 | 753 | 0 | 3260 | … | … | 0 | 0 | 0 | 0 | 13.0 | … | 0.22 | 0.27 |
| 344 | 10 | 868 | 792 | 770 | 772 | 913 | 4115 | 1.0 | Off | 3.1 | 4.0 | 0 | 25.0 | 12.4 | … | … | … |
Table 1. Characteristics of the laser beams and targets in each shot along with measured optical and x-ray signals. The values in columns N2 show the SBS and SRS signals from the N2 beam only. The energy of a parasitic specular light measured by the N2 FABS station is subtracted from these data. Original data are shown in
The full form of the identification number of each shot is SGIIIP-SHOT2019XXX. In what follows, we retain only the last three digits of the shot number.
A. Observations of laser-plasma interaction in the x-ray domain
An example of the time-integrated spectra obtained with the soft x-ray spectrometer (SXS) in three consecutive shots is shown in
![]()
Figure 7.(a) Spectrum of soft x-ray plasma emission obtained with the SXS diagnostic in three consecutive shots: 338 (blue), 339 (red), and 340 (black). Peaks at 367 eV, 653 eV, and 1400 eV correspond to the emission of carbon, oxygen, and copper ions at a plasma temperature of 1.8 keV. (b) Streaked image of plasma observed with the XSC diagnostic in soft x rays in the equatorial plane through the washer slit in shot 338. The
For shots 338 (blue curve) and 339 (red curve), the Cu group shape is in agreement with the plasma temperature of 1.8 keV calculated with the hydrodynamic code and discussed in Sec.
The observed ionization front velocity is of the same order as the ion acoustic velocity of ∼300 µm/ns–350 µm/ns calculated with the hydrodynamic code and discussed in Sec.
XPHC images of the target are shown in
![]()
Figure 8.Hard x-ray pinhole images recorded with XPHC1 [(a) and (b)] and XPHC2 (c) in shots 341 (a) and 342 [(b) and (c)]. The orientation of (a) and (b) is the same as in
The images in
B. Observations of scattered light near the laser frequency
A typical time-resolved spectrum of the scattered light near the laser frequency is shown in
![]()
Figure 9.(a) Time-resolved spectrum of laser light scattered in the N2 FABS near the laser frequency in shot 337. The white and green curves show the time dependence of intensity and the time-integrated spectrum. (b) Time-integrated spectra near the laser wavelength recorded by the N2 FABS station for shots 334 (blue), 335 (red), 336 (black), and 337 (green). In shots 334, 336, and 337, the interaction beam N2 was delayed by 0.5 ns and SSD was turned off; in shot 335, the N2 beam was not activated. The foam density is 10 mg/cm3 in shots 334 and 335, and 12 mg/cm3 in shots 336 and 337.
To understand the origin of these emissions, two shots (335 and 343, with foam densities 10 mg/cm3 and 12 mg/cm3, respectively) were performed with only four heating beams activated. Both S1 and N2 FABS stations were activated and measured nonzero signals.
![]()
Figure 10.(a) Temporal profiles of the heating laser beam S1 (red) and the backward-scattered signal (blue and green, in the SBS and SRS channels, respectively) recorded in shot 335 with only four heating beams activated. (b) Temporal profiles of the heating S1 beam (red), the interaction beam N2 (black, delayed by 1 ns), backward-scattered light near the laser frequency (blue), and backward-scattered SRS signal (green) recorded in the 339. All signals were recorded by the N2 FABS station.
This hypothesis is consistent with the foam homogenization model presented in Sec.
As can be seen from
The second burst of backscattered light shown in
In our experiment, the laser beam focused with a lens f# = 5.4 creates speckles with a transverse size d = f#λ ≃ 1.9 µm and longitudinal length zR = πd2/λ ≃ 32 µm. For a laser intensity 1015 W/cm2, the average speckle power is about 30 MW, which is a factor of 5–10 smaller than the critical power of ponderomotive self-focusing Pcr in a plasma with a temperature of 2 keV and a density of 0.2 ncr. (According to Ref.
The SBS convective gain
While speckle self-focusing is not expected under our interaction conditions, the density perturbations produced by the ponderomotive force in speckles propagate across the plasma as ion acoustic waves and produce laser beam refraction and spraying. According to the theoretical analysis by Grech et al.,
The measured level of SBS in the backward direction is of the order of (5.7 ± 1.3)%, and it is not notably affected by the SSD and foam density variation. This is in agreement with the fact that SBS develops on a time scale of a few picoseconds, which is shorter than the laser beam correlation time. The fraction of scattered light detected with NBS is of the same order of magnitude. It varies in a large range from 0% to 12%, with an average value of 6.3%.
The time-integrated spectra of SBS measured with N2 FABS are shown in
C. SRS observations
Time-resolved and time-integrated spectra of downshifted scattered light measured by the N2 FABS station are shown in
![]()
Figure 11.(a) Time-resolved SRS spectrum of laser light scattered in the N2 FABS below the laser frequency for shot 338. The white and green curves show the time dependence of intensity and the time-integrated spectrum. (b) Time-integrated SRS spectra recorded by the N2 FABS station for shots 338 (blue), 339 (red), 340 (black), 341 (pink), 342 (green), and 344 (cyan). The interaction beam N2 was delayed by 1 ns in all shots, and SSD was turned off in shots 338, 342, and 344. The foam density is 10 mg/cm3 in shots 338, 339, and 344, and 12 mg/cm3 in shots 340, 341, and 342. The depressions in the spectra around 530 nm are due to the interference filter suppressing the second harmonic of laser radiation.
![]()
Figure 12.(a) Time-integrated K
There is no scattered light near the wavelength of 700 nm corresponding to half the laser frequency. Thus, processes near quarter critical density were not activated in our experiment.
The convective gain of SRS in the backward direction is given by the expression
A typical temporal profile of SRS emission measured with N2 FABS is shown in
In the shots with a 0.5 ns delay of the N2 beam, the SRS signal was delayed by 0.25 ns, with a twice smaller reflected fraction of about (14.0 ± 2.3)%. This may indicate a greater role of cold nonionized foam in the zone where the interaction beam enters the target. This issue needs further analysis.
D. Observation of hot electrons
Generation of hot electrons was diagnosed by electron spectrometers and Kα emission. A typical time-integrated image obtained with Kα x rays is shown in
The presence of two spots in the Kα images indicates that the interaction beam propagates throughout the foam from top to bottom, but a small fraction of hot electrons may also be produced by the action of the heating beams. This was confirmed by observation of Kα emission in shot 343, where the N2 beam was absent. However, the action of the N2 beam strongly enhances the Kα emission. A full interpretation of this observation is pending.
The energy range of detected electrons is in qualitative agreement with the process of electron acceleration in the SRS-driven plasma waves. The wavelength range of the SRS spectrum of 450 nm–610 nm corresponds to a range of plasma wave phase velocities vph = (0.13–0.30) c and a range of energies
The Kα imager was absolutely calibrated and provided us with a number of emitted photons. Assuming isotropic photon emission, the total number of emitted photons varied from ∼108 in shot 343, where the interaction beam was disabled, to more than 1010 in shot 342 showing an SRS reflectivity about 28%. However, that diagnostic was activated only in six shots, and it was not possible to observe a correlation between the SRS and Kα signals. One may, however, estimate the total number of hot electrons. Considering the copper excitation cross section of 200–300 b and the probability of photon emission ∼2 × 10⁻³, according to Refs.
V. CONCLUSION AND OUTLOOK
We have studied stimulated scattering of intense laser pulses and hot-electron production in an underdense and hot preformed plasma on the SGIII-P facility. By using a low-density foam target heated by multi-kilojoule laser beams, we succeeded in creating a plasma with a temperature of about 2 keV and a density up to 0.2ncr extending over more than a 1000 laser wavelengths. It was shown that such a plasma produces a rather high level of the scattered light in the near-backward direction. Both SBS and SRS contribute on the levels of ∼15% and ∼30%, respectively, to the plasma reflectivity. While the SBS reflectivity is comparable to the level measured in experiments with gasbags and hohlraums on the same installation,
It is important to note that for the considered average laser intensity of about 1015 W/cm2 at the third harmonic of the Nd:glass laser, the spatial gains of both scattering instabilities, SBS and SRS, are rather small, of the order of 1–3. A notable amplification is achieved in high-intensity speckles and was not suppressed by SSD. This indicates the importance of implementing laser beam temporal smoothing techniques with a larger bandwidth for controlling the plasma reflectivity. A high level of SRS backscattering is qualitatively correlated with hot-electron generation. However, further development of hot-electron diagnostics is needed for quantitative characterization of the number and spectrum of hot electrons.
Foam targets are promising for detailed studies of parametric instabilities in hot large-scale plasmas. In the numerical simulations, the foam ionization front velocity was overestimated, which resulted in a plasma density limited to 0.2ncr and a plasma size limited to 300 µm. Further development of the foam ionization model is needed. This will open the possibility for quantitative design of further experiments with plasmas of a larger size and densities of the order of or larger than the quarter critical density where strong parametric instabilities are expected.
APPENDIX: ORIGINAL SCATTERED ENERGIES MEASURED IN THE EXPERIMENT
The results recorded by N2 SBS FABS in shots 335 and 343 are used to calculate the energy fraction specularly reflected from beam S2. Based on this fraction, the specular reflection contribution is subtracted in all other shots.
References
[1] J. Zheng, B. Zhao, T. Gong, G.-Y. Hu, Z. Li. Noise sources and competition between stimulated Brillouin and Raman scattering: A one-dimensional steady-state approach. Phys. Plasmas, 20, 092702(2013).
[2] W. Zhou, B. Bi, W. Wang, L. Shan, D. Liu, C. Tian, B. Zhang, B. Zhang, Y. Gu, F. Zhang. Realization of high irradiation uniformity for direct drive ICF at the SG-III prototype laser facility. Eur. Phys. J. D, 69, 54(2015).
[3] F. Wang, T. Gong, H. Cai, Y. Ding, R. Zhang, L. Hao, Y. Zhang, X. Peng, Z. Wang, Y. Li, X. Jiang, P. Li, J. Yang, Z. Liu, C. Zheng, X. Li, Q. Li, Y. Liu, S. Li, J. Zheng, F. Wang, S. Zou, S. Liu, D. Wang, L. Guo, T. Xu, D. Yang, S. Jiang, X. Liu, B. Zhang, Z. Li. Recent research progress of laser plasma interactions in Shenguang laser facilities. Matter Radiat. Extremes, 4, 055202(2019).
[4] C. Labaune. Effect of the laser wavelength: A long story of laser-plasma interaction physics for Inertial Confinement Fusion Teller Medal Lecture. EPJ Web Conf., 59, 01012(2013).
[5] W. Seka, D. H. Froula, J. F. Myatt, D. H. Edgell, C. Stoeckl, P.-Y. Chang, S. X. Hu, F. J. Marshall, R. S. Craxton, B. Yaakobi, A. Solodov. Fast-electron generation in long-scale-length plasmas. Phys. Plasmas, 19, 012704(2012).
[6] A. V. Maximov, J. F. Myatt, I. V. Igumenshchev, D. E. Hinkel, D. H. Edgell, P. Michel, D. T. Michel, D. H. Froula, R. W. Short, J. D. Moody, J. Zhang, W. Seka. Multiple-beam laser–plasma interactions in inertial confinement fusion. Phys. Plasmas, 21, 055501(2014).
[7] B. Yaakobi, J. G. Shaw, J. F. Myatt, R. K. Follett, D. H. Edgell, D. H. Froula, D. T. Michel, A. A. Solodov. Simulations and measurements of hot-electron generation driven by the multibeam two-plasmon-decay instability. Phys. Plasmas, 24, 102134(2017).
[8] M. Lafon, D. T. Michel, A. Casner, D. Mangino, R. C. Nora, C. Stoeckl, W. Seka, R. Betti, X. Ribeyre, F. N. Beg, A. Colaïtis, C. Ren, E. Llor Aisa, V. Tikhonchuk, R. Yan, A. R. Christopherson, W. Theobald, A. Bose, M. S. Wei, J. Peebles, W. Shang. Enhanced hot-electron production and strong-shock generation in hydrogen-rich ablators for shock ignition. Phys. Plasmas, 24, 120702(2017).
[9] A. Heron, V. T. Tikhonchuk, C. Riconda, S. Weber, O. Klimo. Fast saturation of the two-plasmon-decay instability for shock-ignition conditions. Phys. Rev. E, 85, 016403(2012).
[10] E. A. Williams, B. B. Afeyan. Unified theory of stimulated Raman scattering and two-plasmon decay in inhomogeneous plasmas: High frequency hybrid instability. Phys. Rev. Lett., 75, 4218(1995).
[11] M. Hohenberger, X. Ribeyre, C. Labaune, D. Batani, A. Casner, S. Baton, G. Schurtz, W. Theobald, O. Klimo, M. Koenig, S. Depierreux, V. T. Tikhonchuk, C. Rousseaux. Physics issues for shock ignition. Nucl. Fusion, 54, 054009(2014).
[12] S. Weber, C. Riconda. Temperature dependence of parametric instabilities in the context of the shock-ignition approach to inertial confinement fusion. High Power Laser Sci. Eng., 3, e6(2015).
[13] A. Héron, V. T. Tikhonchuk, S. Weber, C. Riconda. Kinetic simulations of stimulated Raman backscattering and related processes for the shock-ignition approach to inertial confinement fusion. Phys. Plasmas, 18, 092701(2011).
[14] S. Weber, C. Riconda. Raman–Brillouin interplay for inertial confinement fusion relevant laser–plasma interaction. High Power Laser Sci. Eng., 4, e23(2016).
[15] O. Klimo, V. T. Tikhonchuk, J. Limpouch, S. Weber. Particle-in-cell simulations of laser-plasma interaction for the shock ignition scenario. Plasma Phys. Controlled Fusion, 52, 055013(2010).
[16] O. Klimo, V. T. Tikhonchuk. Laser-plasma interaction studies in the context of shock ignition: The regime dominated by parametric instabilities. Plasma Phys. Controlled Fusion, 55, 095002(2013).
[17] O. Klimo, V. T. Tikhonchuk, J. Psikal, S. Weber. Two-dimensional simulations of laser–plasma interaction and hot electron generation in the context of shock-ignition research. Plasma Phys. Controlled Fusion, 56, 055010(2014).
[18] Y. J. Gu, Ph. Nicolaï, O. Klimo, S. Weber, V. T. Tikhonchuk, S. Shekhanov. Collective absorption of laser radiation in plasma at sub-relativistic intensities. High Power Laser Sci. Eng., 7, e39(2019).
[19] P. Romary, C. Labaune, C. Meyer, S. Hüller, E. Alozy, G. Riazuelo, Ph. Nicolaï, J. Limpouch, D. Pesme, S. Depierreux, G. Thiell, C. Riconda, C. Stenz, P. Loiseau, W. Nazarov, B. Villette, R. Wrobel, P. Di-Nicola, N. G. Borisenko, S. Weber, C. Reverdin, D. T. Michel, G. Soullie, M. Casanova, V. T. Tikhonchuk, M. Grech. Laser smoothing and imprint reduction with a foam layer in the multikilojoule regime. Phys. Rev. Lett., 102, 195005(2009).
[20] R. Bahr, A. Orekhov, V. Tassin, C. Baccou, G. Tran, V. Tikhonchuk, W. Seka, J. Katz, C. Stoeckl, S. Hüller, D. Pesme, P.-E. Masson-Laborde, A. Colaïtis, C. Neuville, C. Labaune, M. Casanova, A. Héron, G. Duchateau, A. Debayle, Ph. Nicolaï, S. Depierreux, C. Riconda, P. Loiseau, N. Borisenko. Experimental investigation of the collective Raman scattering of multiple laser beams in inhomogeneous plasmas. Phys. Rev. Lett., 117, 235002(2016).
[21] J. E. Ralph, W. Seka, E. M. Campbell, P. Michel, C. Goyon, A. A. Solodov, R. W. Short, M. Hohenberger, R. Epstein, M. A. Barrios, J. D. Moody, T. Chapman, J. F. Myatt, J. W. Bates, S. P. Regan, M. J. Rosenberg. Origins and scaling of hot-electron preheat in ignition-scale direct-drive inertial confinement fusion experiments. Phys. Rev. Lett., 120, 055001(2018).
[22] C. S. A. Musgrave, K. Nagai, W. Nazarov. A review of low density porous materials used in laser plasma experiments. Phys. Plasmas, 25, 030501(2018).
[23] M. W. Jones, J. Edwards, O. Willi, M. Dunne, M. Desselberger. Use of x-ray preheated foam layers to reduce beam structure imprint in laser-driven targets. Phys. Rev. Lett., 74, 2961(1995).
[24] F. Filippi, S. D. Baton, H. Habara, K. A. Tanaka, S. N. Chen, C. Rousseaux, W. Nazarov, Ph. Nicolai, P. Antici, J. Fuchs, K. Morita, M. Nakatsutsumi, T. Iwawaki, M. Starodubstev. Density and temperature characterization of longscale length, near-critical density controlled plasma produced from ultra-low density plastic foam. Sci. Rep., 6, 21495(2017).
[25] H. X. Vu, D. C. Wilson, R. J. Mason, R. G. Watt, R. A. Kopp, M. Dunne, S. R. Goldman, O. Willi. Computational study of laser imprint mitigation in foam-buffered inertial confinement fusion targets. Phys. Plasmas, 5, 211(1998).
[26] J. Limpouch, R. Liska, M. Kuchařík, T. Kapin. Hydrodynamic simulations of laser interactions with low-density foams. Czech J. Phys., 56, B493(2006).
[27] J. Limpouch, S. Yu. Gus’kov, V. T. Tikhonchuk, Ph. Nicolaï. Laser-supported ionization wave in under-dense gases and foams. Phys. Plasmas, 18, 103114(2011).
[28] J. Limpouch, R. Liska, V. Tikhonchuk, J. Velechovsky. Hydrodynamic modeling of laser interaction with micro-structured targets. Plasma Phys. Controlled Fusion, 58, 095004(2016).
[29] S. Yu. Gus’kov, G. Di Giorgio, R. De Angelis, P. Andreoli, F. Consoli, F. Ingenito, A. A. Rupasov, M. Cipriani, G. Cristofari. Laser-supported hydrothermal wave in low-dense porous substance. Laser Part. Beams, 36, 121(2018).
[30] M. A. Belyaev, O. S. Jones, S. H. Langer, R. L. Berger, D. A. Mariscal. Laser propagation in a subcritical foam: Ion and electron heating. Phys. Plasmas, 25, 123109(2018).
[31] Y. J. Gu, V. Tikhonchuk, O. Klimo, J. Limpouch, S. Weber. Studies of laser-plasma interaction physics with low-density targets for direct-drive inertial connement schemes. Matter Radiat. Extremes, 4, 045402(2019).
[32] G. Zhang, W. Zheng. 2D hydrodynamic simulation of a line-focused plasma in Ni-like Ag x-ray laser research. Chin. Phys. B, 16, 2439(2007).
[34] M. Kuchařík, R. Liska, J. Velechovský, J. Limpouch, L. Bednárik, P. Váchal, O. Renner. ALE method for simulations of laser-produced plasmas. Finite Vol. Complex Appl. VI, 4, 857(2011).
[35] S. J. Davidson, C. A. Iglesias, E. Minguez, F. J. D. Serduke. WorkOp-IV summary: Lessons from iron opacities. J. Quant. Spectrosc. Radiat. Transfer, 65, 527(2000).
[36] G. B. Zimmerman, K. H. Warren, D. A. Young, R. M. More. A new quotidian equation of state (QEOS) for hot dense matter. Phys. Fluids, 31, 3059(1988).
[37] M. Cipriani, G. Cristofari, G. Di Giorgio, F. Consoli, A. A. Rupasov, S. Yu. Gus’kov, P. Andreoli, R. De Angelis. Absorption coefficient for nanosecond laser pulse in porous material. Plasma Phys. Controlled Fusion, 57, 125004(2015).
[38] F. Rosmej, M. Šmìd, O. Renner, D. Khaghani. Investigation of x-ray emission induced by hot electrons in dense Cu plasmas. Phys. Scr., T161, 014020(2014).
[39] A. D. Dahl. SIMION for the personal computer in reflection. Int. J. Mass Spectrom., 3, 2000.
[40] V. Tassin, P.-E. Masson-Laborde, S. Depierreux, P. Loiseau, C. Goyon, V. Yahia, D. T. Michel, C. Labaune, C. Stenz. Experimental investigation of the stimulation Brillouin scatering growth and saturation at 526 and 351 nm for direct drive and shock ignition. Phys. Plasmas, 19, 012705(2012).
[41] C. Baccou, A. Orekhov, V. Yahia, D. Teychenné, C. Labaune, G. Loisel, O. Rosmej, P.-E. Masson-Laborde, T. Rienecker, N. G. Borisenko, C. Goyon, S. Depierreux. Reduction of stimulated Brillouin backscattering with plasma beam smoothing. Phys. Plasmas, 22, 042707(2015).
[42] P. E. Masson-Laborde, P. Loiseau, Ch. Labaune, S. Hüller, D. Pesme, H. Bandulet, S. Depierreux. Stimulated Brillouin scattering reduction induced by self-focusing for a single laser speckle interacting with an expanding plasma. Phys. Plasmas, 21, 032703(2014).
[43] W. L. Kruer. The Physics of Laser Plasma Interactions(1988).
[44] M. N. Rosenbluth, C. S. Liu, R. B. White. Raman and Brillouin scattering of electromagnetic waves in inhomogeneous plasma. Phys. Fluids, 17, 1211(1974).
[45] H. A. Rose. Random phase plate hot spots and their effect on stimulated Brillouin backscatter and self-focusing. Phys. Plasmas, 2, 2216(1995).
[46] H. A. Baldis, V. T. Tikhonchuk, C. Labaune. Modeling of a stimulated Brillouin scattering experiment with statistical distribution of speckles. Phys. Plasmas, 3, 3777(1996).
[47] V. T. Tikhonchuk, Ph. Mounaix, D. Pesme. Stimulated Brillouin scattering reflectivity in the case of a spatially smoothed laser beam interacting with an inhomogeneous plasma. Phys. Plasmas, 4, 2658(1997).
[48] V. T. Tikhonchuk, S. Weber, G. Riazuelo, D. Pesme, M. Grech. Coherent forward stimulated-Brillouin scattering of a spatially incoherent laser beam in a plasma and its effect on beam spray. Phys. Rev. Lett., 102, 155001(2009).
[49] C. Hombourger. An empirical expression for K-shell ionization cross section by electron impact. J. Phys. B: At., Mol. Opt. Phys., 31, 3693(1998).
[50] C. P. Ridgers, R. P. Drake, M. Sherlock, C. Kuranz, A. G. R. Thomas. Hybrid Vlasov–Fokker–Planck–Maxwell simulations of fast electron transport and the time dependance of K-shell excitation in a mid-Z metallic target. New J. Phys., 4, 015017(2013).

Set citation alerts for the article
Please enter your email address
© Copyright 2018-2021 | Chinese Laser Press. All Rights Reserved 沪ICP备15018463号-20