
O. Renner, F. B. Rosmej. Challenges of x-ray spectroscopy in investigations of matter under extreme conditions[J]. Matter and Radiation at Extremes, 2019, 4(2): 24201
- Matter and Radiation at Extremes
- Vol. 4, Issue 2, 24201 (2019)
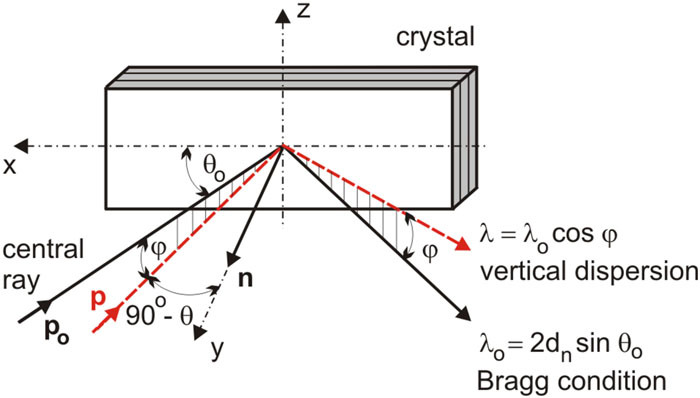
Fig. 1. Dispersion of X rays at a flat single crystal.
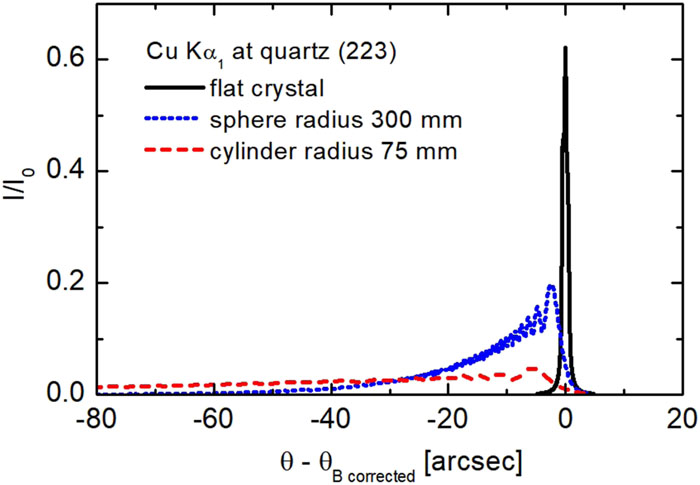
Fig. 2. Theoretical rocking curves calculated for reflection of Cu Kα1 radiation from flat, spherically bent (radius 300 mm), and cylindrically bent (Johann geometry, bending radius 75 mm) crystals of quartz (223) as functions of the angular deviation of the incident beam from the refractive-index-corrected Bragg angle θ Bcorrected.
Fig. 3. General geometry of spectroscopic schemes with 2D bent crystals.
Fig. 4. Schematic of a vertical dispersion double-crystal spectrometer.
Fig. 5. Geometry of von Hamos-type spectrometer.
Fig. 6. Schematic of a conical crystal spectrometer.
Fig. 7. Schematic of the vertical dispersion geometry Johann spectrometer.
Fig. 8. Schematic of a transmission-crystal hard X-ray spectrometer.
Fig. 9. Geometry of a spherically bent crystal spectrometer in 2D mode.
Fig. 10. Integrated reflectivities R int calculated for five reflection orders of a mica crystal spherically bent to a radius of 150 mm.
Fig. 11. Overlap of H-, He-, and Li-like Cl transitions observed using the spherically bent mica spectrometer in two diffraction orders.
Fig. 12. K-shell X-ray emission of copper induced by irradiating 1.5μ-thick Cu foils with the PALS kJ laser at an intensity of 1016 W/cm2 and laser wavelengths of 1.315 µ m (1ω ) and 0.438 µ m (3ω ).
Fig. 13. Scaling properties of suprathermal electrons propagating in solid-density warm copper visualized with 3D spectroscopic observations. Suprathermal electrons were generated by irradiating the solid copper with the fs-laser ELFIE74 at intensities of 1019 W/cm2 and variable distances Δx of the focal spot from the target edge (a). The observed spatially resolved Kα emission along the z direction (note that the color scale is not identical in individual images) for various distances Δx is shown in (b), and the dependence of the scaling length of Kα1 intensity with respect to Δx in (c).
Fig. 14. X-ray imaging of plasma jets accelerated when irradiating Al foil with the PALS kJ laser. Plasma jets penetrate into the ambient cold gas (air) at a pressure of 19 Pa, thereby inducing a rich spatial and wavelength-dependent structure in the emitted X-ray spectra.
Fig. 15. Plasma jet production at normal (a) and oblique (b) laser incidence on thin Al foil. Even in the latter case, the jet propagates in a direction perpendicular to the foil surface, and this jet is used in investigating trapping of the highly charged Al ions on the secondary target surface (c).
Fig. 16. Spatially resolved spectra of Al Lyγ and Lyδ self-emission from a laser-irradiated double-foil Al/C target. The laser strikes the primary Al-foil target at oblique incidence from below.
Fig. 17. Impact of interference effects (IFE) on the Stark broadening of dielectronic satellite X-ray spectra emitted from 1s 2l 2l ′ and 1s 2l 3l ′ excited states of aluminum. In near-solid-density matter, interference effects result in a crucial emission group narrowing.
Fig. 18. (a) Spatially resolved traces of Al Heα spectra observed as a function of the distance from the surface of a laser-irradiated composite target. (b) The spectrum emitted from the surface of 20-μ m-thick Al foil sandwiched between two plastic substrates was decomposed into resonance w , intercombination y , and satellite components using genetic algorithm code fitting.
Fig. 19. Simulations of Kr Lyα emission (13 429/13 509 eV) modified by a variable-intensity, linearly polarized laser beam. Figure provided courtesy of E. Stambulchik.
Fig. 20. K-shell X-ray emission of magnesium irradiated with different laser conditions, using either a beam with extremely high contrast 1010–1011 or preceded by a prepulse. (a) Comparison of high-contrast and double-pulse spectra of Heβ until Lyβ. (b) Comparison of high-contrast and double-pulse spectra of Heα and satellite emission. The MARIA simulations indicate near solid density n e ≈ (3–4) × 1023 cm−3, temperature kT e ≈ 0.2–0.3 keV, and expansion velocities of the order of V ≈ 3 × 107 cm/s. The expansion velocity combined with radiation transport results in a characteristic steep rise in the Heα-intensity on the blue line wing (see the red arrow).
Fig. 21. Distribution function of high-energy electrons observed in PW laser experiments with bare foil (blue lines) and nanowire-coated (red) targets. Owing to the line crossing at lower energies, this energy region represents a very interesting domain for potential X-ray spectroscopic observations. Suprathermal electron populations have been recorded with an electron spectrometer collecting the electrons escaping from the front side of the target.
Fig. 22. K-shell X-ray emission from 1.5-μ m-thick aluminum foil irradiated with a 160 J, 0.7 ps, 1.064 µ m PW laser beam at I = 3 × 10²⁰ W/cm2. Strong hollow ion emission between Lyα and Heα is observed.
Fig. 23. Cartoon of hollow crystal formation due to XFEL irradiation of a solid.
Fig. 24. MARIA code simulations of the XUV spectra induced by XUV-FEL interaction with solid aluminum. (a) Simulations taking into account only the Ne-like transitions K2L7M1–K2L8 (blue solid curve). (b) Simulations taking into account the Ne-like transitions K2L7M1–K2L8 as well as transitions from dielectronic satellites of Na-like (red dashed curve) and Mg-like (red solid curve) aluminum, K2L7M2–K2L8M1 and K2L7M3–K2L8M2, respectively.
Fig. 25. MARIA code simulation of the spectral distribution of Na-like dielectronic satellites K2L7M2–K2L8M1 of aluminum, depending on the electron temperature.
Fig. 26. MARIA code simulation of the temporal evolution of hollow ion X-ray emission induced via K-shell photoionization driven by intense XFEL irradiation of a dense aluminum plasma at n e = 1021 cm−3 and kT e = 30 eV in a pump probe configuration. Solid and dashed lines correspond to simulations with photoionization from K1 switched on and off, respectively.
|
Table 1. Line-shift measurements in units of 10−10 m (first values) and OEFTIS calculations (second values) of H-like and He-like aluminum lines in dense laser-produced plasmas. Heα measurements have been performed at ne = 2.2 × 1022 cm−3, kBTe = 400 eV (Ref. 98 ) and at ne = 2.2 × 1023 cm−3, kBTe = 330 eV (Ref. 101 ), Heβ measurements at ne = 8 × 1023 cm−3, kBTe = 220 eV (Ref. 96 ) and at ne = 5 × 1023 cm−3, kBTe = 560 eV (Ref. 100 ), Lyman series measurements at ne = 1.5 × 1022 cm−3 and kBTe = 1400 eV (Ref. 95 ), and Lyα measurements at ne = 5 × 1023 cm−3 and kBTe = 280 eV (Ref. 96 ).

Set citation alerts for the article
Please enter your email address
© Copyright 2018-2021 | Chinese Laser Press. All Rights Reserved 沪ICP备15018463号-20