O. Renner, F. B. Rosmej. Challenges of x-ray spectroscopy in investigations of matter under extreme conditions[J]. Matter and Radiation at Extremes, 2019, 4(2): 24201
Copy Citation Text
Advanced X-ray spectroscopic methods provide unique and critical data to study matter under extreme environmental conditions induced by high-intensity and high-energy lasers. The aim of this paper is to contribute to a contemporary discussion of the role of X-ray spectroscopy in the investigation of radiative properties of strongly coupled, highly correlated, and frequently weakly emissive plasma systems formed in matter irradiated by sub-petawatt and petawatt class lasers. After reviewing the properties of different X-ray crystal spectrometers, high-resolution X-ray diagnostic methods are surveyed with respect to their potential to study plasma-induced and externally induced radiation fields, suprathermal electrons, and strong electromagnetic field effects. Atomic physics in dense plasmas is reviewed with emphasis on non-Maxwellian non-LTE atomic kinetics, quasi-stationary and highly-transient conditions, hollow ion X-ray emission, and field-perturbed atoms and ions. Finally, we discuss the role of X-ray free electron lasers with respect to supplementary investigations of matter under extreme conditions via the use of controlled high-intensity radiation fields.
I. INTRODUCTION
X-ray spectroscopy has proven to be one of the most valuable diagnostic methods for the determination of system parameters and the exploration of various physical phenomena occurring in plasmas. The accessible parameter range covers orders of magnitude in temperature and especially in density, because practically all elements can be used to study the plasma-affected radiative properties of the respective system. These diagnostic elements may be intrinsic or they may be intentionally injected (as so-called tracer elements) into the matter under study. This gives plasma spectroscopy a thoroughly interdisciplinary nature, as confirmed by numerous reviews1–8 and commercially available diagnostic codes.9,10
The rapid development of high-intensity, high-energy optical lasers as well as free-electron extreme ultraviolet (XUV) and X-ray lasers has provided new tools for the investigation of matter under extreme conditions of temperature, density, and fields that have never hitherto been achievable in the laboratory. This has resulted in a renewed worldwide interest in the study of high-density matter, e.g., strongly coupled plasmas, warm dense matter, and compressed matter above solid density, as well as in applications to inertial fusion science, astrophysics, and planetary science. High-density matter likewise has important links to atomic physics in dense plasmas11–15 because the dense plasma environment strongly perturbs atomic and ionic Coulomb fields and drives complex excitations. This results in important changes in quantum mechanical wavefunctions, thereby changing atomic structure and radiative properties, as well as almost all thermodynamic properties (e.g., the equation of state) via changes to the grand canonical partition function. Owing to the high density, opacity is important in almost all experimental conditions, and consequently X-ray spectroscopy is the primary tool for studying matter under extreme conditions.
X-ray spectroscopic investigation of extreme states of matter is faced with numerous challenges. The first of these relates to the high level of environmental radiation (originating, e.g., from bremsstrahlung due to the presence of MeV electrons, material activation, etc.) that is characteristic of interaction experiments with high-intensity lasers in the petawatt (PW) and megajoule class. These harsh environmental conditions impact directly on selection of diagnostic methods and of appropriate instruments and experimental geometries. Therefore, the primary question is whether high-resolution X-ray spectroscopy can be implemented efficiently enough to be considered a unique and powerful diagnostic for the study of dense matter under extreme conditions. The second challenge relates to exploration of the extreme conditions themselves and to the utilization of exotic radiative transitions for characterization of diverse phenomena, e.g., the generation and transport of suprathermal electrons, the effects of induced radiation fields, electromagnetic fields, and ultra-fast dynamics. These studies go far beyond the scope of standard diagnostic methods, and exploration of exotic transitions16,17 such as X-ray dielectronic satellites and X-ray hollow ion emission has been proposed for novel studies. For example, it has been shown that X-ray dielectronic satellite emission recorded with high-resolution X-ray instruments provides a possibility to characterize hot electrons in experiments relevant to inertial fusion,18–20 that highly-resolved hollow ion X-ray spectra can be recorded in PW class laser experiments employing advanced X-ray spectroscopic methods,21 and that the development of novel micro-pillar array targets22 allows control of the hot electron fraction in advanced studies at PW class lasers. The third challenge concerns atomic physics in dense plasmas, e.g., the energetic structure of perturbed atoms and ions and the development of suitable diagnostic methods and theoretical models. These methods include, e.g., spectral line broadening, occurrence of local extremes (dips and bumps) in line profiles, generalized atomic processes, and the well-known ionization potential depression that is linked directly to the theory of perturbed quantum mechanical atoms.
The aim of the present review is to contribute to the current discussion of the role of X-ray spectroscopy in investigation of matter under extreme conditions. We concentrate on high-resolution spectroscopic experiments practicable with sub-PW and PW class lasers. We also discuss a few aspects of the X-ray free electron laser (XFEL) sources that allow exploration of complex high-density atomic physics in well-controlled radiation fields. To illustrate the experimental approaches employed and to stimulate further developments, we first provide a brief survey of high-resolution spectroscopic methods and define their limits. Next, we discuss situations where X rays offer the most efficient and sometimes the only vehicle capable of providing the desired diagnostic information. This requires interlinking of the measured radiative properties with phenomena occurring in extreme-state matter and with the application of well-tested advanced instrumentation suitable for obtaining high-quality spectroscopic data.
II. ADVANCED SCHEMES OF X-RAY CRYSTAL SPECTROMETERS
The challenging requirements for collection of high-resolution X-ray spectra needed for diagnosis of environmental conditions and identification of exotic radiative phenomena in extreme-state matter are generally met by the application of crystal spectrometers. These instruments cover the range of photon energies E limited by the lattice spacing d of the available spectroscopic-quality diffraction crystals,23 currently from approximately 250 eV (via application of organic maleate single crystals with 2d spacing about 6 nm) to 100 keV [corresponding, e.g., to X-ray diffraction from the quartz (502) crystal at a shallow glancing angle of 5°]. Note that ultra-soft X-ray radiation composed of less-energetic photons with E < 250 eV is usually dispersed by diffraction gratings,24 whereas radiation with E > 100 keV is frequently analyzed using the lower-resolution methods of γ-ray spectroscopy, including, e.g., nuclear activation, Cherenkov detection, and energy-dispersive bremsstrahlung spectrometers based on K-edge and differential absorption filter techniques in combination with diverse types of dosimeter.25 Taking into account that the photon energies of Lyα emission (i.e., the 2p2P3/2,1/2 → 1s2S1/2 transition in H-like ions) of B and U are 255 eV and 102 keV, respectively, the above-defined range of photon energies covered by diffraction crystals complies with the scope of this paper, namely, spectroscopic research of X-ray emission from highly charged ions.
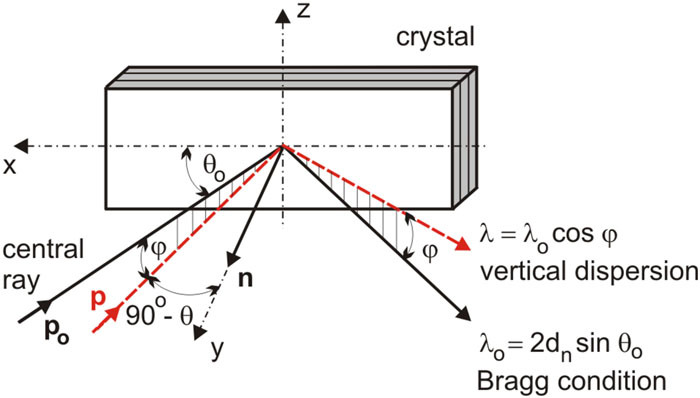
The relations describing the Bragg reflection of X-rays at a flat crystal are summarized in Fig. 1. Radiation impinging on the crystal in the direction of the unit vector p0 is dispersed in the plane of incidence defined by the central ray and the relevant reciprocal lattice vector n of the crystal (hereinafter the horizontal or meridional plane). The wavelengths of the rays diffracted in the nth crystallographic order satisfy the Bragg conditionwhere λ0 is the wavelength of the ray reflected at glancing angle θ0 and dn is the refractive-index-corrected interplanar spacing of the crystal. Note that X-ray reflection from the crystal does not strictly follow the Bragg law. Depending on the crystal’s composition, structure, surface orientation, and geometric shape, rays with a given wavelength are diffracted in a finite angular range close to the Bragg angle. The angular dependence of the ratio I/I0 of the reflected (I) and incident (I0) intensities (the so-called rocking curve) follows from the kinematic or dynamic theory of X-ray diffraction26,27 and depends on the wavelength and polarization of the incident radiation, the perfectness of the crystal, and the bending radius.28 The importance of the last of these parameters is illustrated in Fig. 2, from which we can compare the values of the FWHM rocking curve width Δθ, its peak value P%, and the integrated reflectivity Rint (which determine the overall crystal response to monochromatic radiation of a given wavelength) calculated for nonpolarized Cu Kα1 radiation (λ = 0.154 06 nm) diffracted from a quartz (223) crystal with 2dn = 0.2024 nm. For a flat crystal, a crystal bent spherically to a radius of 300 mm, and a Johann type crystal bent cylindrically to a radius of 75 mm, we get Δθ = 1.14, 9.5, and 37.4 arcsec (which correspond to intrinsic spectral resolutions λ/Δλ = tan θ/Δθ ∼ 2 × 10⁵, 2.5 × 10⁴, and 6.4 × 10³), P% = 62%, 19.9%, and 4.8%, and Rint = 3.5, 14.5, and 13.0 µrad, respectively. In accordance with the theory of X-ray diffraction at bent crystals,27 the peak reflectivity decreases with the bending radius, whereas the rocking curve width increases and displays a more asymmetric shape with a long oscillating tail. Moreover, the reflectivities of σ/π-polarized radiation (with the electric field vector parallel/perpendicular to the crystal surface) differ by a factor of cos(2θ) and vary abruptly when the wavelengths of the diffracted radiation come close to the absorption edges of the elements contained in the crystal. All of these factors should be taken into account when investigating the transfer function of a spectrometer.
Figure 1.Dispersion of X rays at a flat single crystal.
Figure 2.Theoretical rocking curves calculated for reflection of Cu Kα1 radiation from flat, spherically bent (radius 300 mm), and cylindrically bent (Johann geometry, bending radius 75 mm) crystals of quartz (223) as functions of the angular deviation of the incident beam from the refractive-index-corrected Bragg angle θBcorrected.
The vertical divergence φ of the rays, i.e., their declination from the horizontal plane defined in Fig. 1 and characterized by the unit vector p, is usually restricted to values that virtually decrease the horizontal glancing angle θ0 but have a negligible effect on the dispersion of the spectrometer. At larger values of φ, however, this effect cannot be neglected and, as follows from the scalar product n · p, sin θ = sin θ0 cos φ. Consequently, the Bragg law must be complemented by the vertical dispersion conditionwhich determines the wavelength λ reflected at a given angle φ. This simple relation represents the basis of operation of vertical dispersion spectrometers.29,30 For each λ, reflection occurs at angles ±φ; thus, rays with wavelength slightly shorter than λ0 are dispersed in the vertical direction symmetrically about the horizontal plane. Consequently, vertical dispersion instruments provide simultaneously two sets of mirror-symmetric spectra. Their extremely high angular dispersion dφ/dλ = −1/(λ tan φ) reduces the geometric apparatus smearing introduced by a finite source size and the detector pixels, and thus the resolving power of the instrument may approach the single-crystal diffraction limit even at moderate source-to-detector distances. A rigorous description of X-ray diffraction at crystals and its beneficial application is the first principle to be applied in the development of novel X-ray spectrometers allowing spectral line emission to be measured with a precision not previously available.
The second principle applied in the advanced X-ray spectroscopic diagnosis of matter under extreme conditions refers to the characteristic properties of the investigated spectra. The line emission from plasmas produced by short laser pulses is typically weak and overlapped with the free–free and free–bound continuum, scattered and fluorescence radiation, and spurious signals due to the action of accelerated particles (resulting in energetic bremsstrahlung and material activation). Consequently, the acquisition of high-quality experimental data suitable for analysis of environmental plasma conditions frequently requires the application of high-collection-efficiency focusing schemes based on one- or two-dimensionally (1D or 2D) bent crystals combined with detectors shielded against the radiative background and magnets deflecting the particle fluxes. The main characteristics of toroidally bent Bragg-type diffractors can be understood from Fig. 3. The focusing properties in the horizontal and vertical (also called sagittal) planes are described by the mirror equationwhere p and q are source-to-crystal and crystal-to-image distances, fh = (Rh sin θ)/2 and fv = Rv/(2 sin θ) are the focal lengths, and Rh and Rv are the radii of curvature of the crystal in the horizontal and vertical planes, respectively.31 The properties of the instrument depend on the type and curvature (1D or 2D) of the particular crystal, and on the relative positions of the X-ray source, crystal, and detector. The focusing in the dispersion (meridional) plane follows the classic Johann/Johansson geometry developed for cylindrically bent crystals.32 In both these schemes, the diffracting planes are bent to the same radius Rh, and their difference constitutes the curvature of the crystal surface. Whereas in the Johann geometry, the surface follows the shape of the bent diffracting planes, the surface of the Johansson-type crystal is ground to a radius Rh/2, i.e., it lies on the Rowland circle (RC), the diameter of which is Rh. Theoretically, this geometry should result in improved focusing of the rays reflected from the crystal, but, in practice, the advantages of the Johansson over the Johann spectrometer are less than expected owing to additional errors introduced by the crystal fabrication process. In addition, some crystals cannot be ground to the desired Johansson geometry, e.g., mica and layered synthetic microstructures. Therefore, we will concentrate on Johann-type spectrometers.
Figure 3.General geometry of spectroscopic schemes with 2D bent crystals.
Neglecting the Johann imaging error, monochromatic radiation emitted from a point source lying on the RC is focused to a point (the so-called monochromatic crossover) symmetrically positioned on the same circle, i.e., at a distance q = Rh sin θ from the crystal. Consequently, the best spectral resolution can be achieved with the detector positioned close to the RC. The range of Bragg angles (i.e., also the range of wavelengths diffracted using the crystal with a particular 2dn value) covered in a concrete experimental configuration is given by the projection of the source on the RC via the angle subtending the left- and right-hand margins of the crystal in the meridional plane (depicted by red rays in Fig. 3). Another important feature of the Johann scheme is the existence of a polychromatic (meridional) focus for source-to-crystal distances p > Rh sin θ, i.e., for sources positioned outside the RC. Owing to the existence of this crossover, the experimental scheme can be complemented by an additional shield with a crossover-size-fitted slit that considerably reduces the spurious scattered and fluorescence radiation impinging on the detector.
Instruments with 2D bent crystals combine spectral with 1D spatial resolution in the sagittal direction (for Johann-type cylindrically bent crystals, the spatial resolution can be introduced by a narrow horizontal slit positioned between the source and the crystal). To achieve simultaneously the maximum possible spectral and spatial resolutions, two conditions must be fulfilled: (i) the detector should be placed at the above-defined distance q = Rh sin θ and (ii) the source-to-crystal distance should be set towhich follows from the mirror equation in the sagittal plane. For spherically bent crystals where Rv = Rh, this relation can obviously be satisfied only for θ > 45°. On the other hand, toroidally bent crystals fulfilling the condition Rv/Rh = sin2θ for the same focal lengths in the meridional and sagittal plane provide greater experimental freedom (at the cost of considerably more expensive diffractors). The 1D spatial (sagittal) magnification of the scheme, k = q/p, can be adapted according to experimental requirements. If needed, a trade-off should be made in the choice of the p and q values by positioning the source and detector at distances optimized from the point of view of achieving the maximum spectral or spatial resolution.
The design of a concrete experiment starts from a definition of the desired spectroscopic parameters, in particular from the wavelength range covered, and a combination of the spectral, spatial, and prospectively also temporal resolution, which can be in special cases be replaced by a properly selected target geometry, e.g., by the application of dot or structured targets. For instance, precise measurements of the gradual spectral line merging and profile modification of higher Lyman series members of hydrogenic Al (Ref. 33) benefited from application of Al square microdots with thickness about 1 µm deposited on 10 µm thick plastic. By focusing the laser beam to a diameter substantially larger than the dot diagonal, the Al plasma was confined within a narrow jet by the plasma from the surrounding substrate and, moreover, the duration of H-like Al emission observed at a given distance from the original dot surface was limited by the dot thickness to about 100 ps. In other words, the combination of laser-irradiated dot targets with the spectrometer providing simultaneously high spectral and spatial resolution resulted in acquisition of high-quality spectroscopic data suitable for investigation of X-ray line emission from quasi-single-parameter plasmas.33
The final experimental geometry should be optimized using a ray-tracing procedure; see, e.g., Refs. 34 and 35. With regard to practical aspects, the selection of diffractors is limited by their reflectivity, the presence of absorption edges, higher-order reflections, and the spatial distribution of their imperfections—waviness of the crystal surface can result in a spurious structure of spectral line profiles.28 The proper choice of experimental scheme is decisive for obtaining the maximum spectral (typically at the level of λ/Δλ ∼ 103–104) and spatial (∼2 µm) resolution, collection efficiency, precision of intensity measurements, and reliability and reproducibility of spectral records. The potential of selected precise spectroscopic methods will be briefly discussed in the following paragraphs.
The simplest wavelength-dispersive instruments are based on application of flat single crystals, typically compact easy-to-align, low-collection-efficiency mini-spectrometers with a short source-to-crystal-to-detector distance, and spectra detection using X-ray film or imaging plates.36 The monochromatic radiation emitted from a point source is diffracted from the crystal in a cone with its axis perpendicular to the crystal surface and vertex angle 90° − θ. For extended sources, the spectral resolution of these spectrometers is not limited by the rocking curve width but by the source or detector pixel size. A crude spatial resolution at the level of several tens of micrometers can be achieved by placing a narrow horizontal slit between the source and the crystal. Consequently, the application of these instruments is usually restricted to plasma diagnosis based on ratios of integrated reflectivities of properly selected spectral lines.9
In contrast, a relatively novel group of flat-crystal spectrometers based on the vertical dispersion principle30 is characterized by a combination of intrinsic high spectral and spatial resolution supplemented by simultaneous production of two highly dispersed spectra. A schematic of such an instrument, the vertical variant of the double-crystal spectrometer, is depicted in Fig. 4. X rays emitted from a source extended along the y axis are successively diffracted from two single crystals, and the central wavelength λ0 is determined by the angle 2θ0 between their surfaces. Rays with wavelength λ shorter than λ0 are diffracted in the vertical plane parallel to the intersection of diffraction planes of both crystals in accordance with the relation (2). The spectral resolution can in principle exceed the single-crystal rocking curve limit, and the unit magnification 1D spatial resolution along the y axis is given by the width of the composite rocking curve,37 but, in practice, it is limited by the pixel size of the detector to about 10 µm. A partial drawback of this instrument is its limited spectral range (about 3% of λ0) given by the vertical size of the crystals and a lower collection efficiency due to successive diffraction of X rays from two crystals. For instance, when investigating the detailed line profiles of Al Lyα doublet using flat ammonium dihydrogen phosphate (ADP) (101) crystals, the collection efficiencies of single- and double-crystal spectrometers with source-to-detector distances of 100 mm differ by a factor of 25, whereas the spectral resolution increases from 910 up to 104, i.e., above the ADP single-crystal diffraction limit (8200). Even at moderate laser parameters (energy 80 J, wavelength 0.53 µm, pulse duration 1.2 ns, 3 × 10¹⁴ W/cm2 at the target), well-resolved spectral lines could be recorded in single shots.38 On the other hand, the double-crystal spectrometer is especially useful for ultrahigh-resolution spectroscopy of laser-produced plasmas, e.g., for precise measurements of X-ray line transfer in expanding plasmas with large velocity gradients.39
Figure 4.Schematic of a vertical dispersion double-crystal spectrometer.
Among instruments based on 1D bent diffractors, the von Hamos spectrometer40 is frequently used owing to its extreme collection efficiency. The geometric setup of this instrument is shown in Fig. 5. Both the source and the detector are positioned on the axis of a cylindrically bent crystal, and radiation emitted from a point source at a given wavelength λ is diffracted from the circular arc on the crystal surface defined by the relevant angle θ and focuses at a distance x = 2R/tan θ. The spectrometer provides spatial resolution along the y axis, and the spectral resolution is limited by the broadening of the rocking curve (cf. Fig. 2) and by the source extension not only along the x direction but also along the z axis. A detailed analysis of the properties of this spectrometer was provided by Yaakobi et al.41 The characteristics of a concrete configuration, including schemes with mosaic crystals (here the application of highly oriented pyrolytic graphite crystals42 is very popular), segmented crystals,43 etc. can easily be estimated using one of the above-mentioned ray-tracing codes.
A partial drawback of this scheme is the shallow angle of incidence of the diffracted radiation on a detector placed parallel to and intersecting with the cylinder axis (usually pointing at the center of the interaction chamber where the target is positioned). This leads to difficulties with experimental designs based on the use of large electronic detectors (CCDs and X-ray streak cameras), for which quasi-perpendicular incidence of X rays on the sensitive elements is preferred. This problem can be overcome by bending the crystal over the surface of a cone instead of a cylinder.44 A schematic of such a conical crystal spectrometer is presented in Fig. 6. With the nodal line being parallel to the x axis, polychromatic radiation emitted from a point source is focused approximately into a vertical line perpendicular to the x axis and containing the apex of the cone. The X-ray source, however, is not located on the cone axis. Consequently, the spatial resolution along the y axis is limited by the spherical aberrations of the system, and, also, monochromatic rays do not focus exactly at the same point, which affects the spectral resolution.45 These drawbacks are eliminated in multi-cone crystal spectrometer design46 in which the diffracting crystal consists of many interconnected cone surfaces whose axes intersect a point X-ray source. The rotational symmetry of the ray pattern obtained for each Bragg angle should result in perfect focusing of the radiation emitted from the point source, thus providing high-resolution, high-photon-throughput spectra.
Figure 6.Schematic of a conical crystal spectrometer.
The application of the vertical dispersion principle to 1D bent crystal spectrometers is illustrated by the vertical geometry Johann spectrometer (VJS)47 shown schematically in Fig. 7. In this configuration, both the source and the detector are positioned on the RC; i.e., in the meridional plane, the instrument works like a monochromator. By using the principle of vertical dispersion, it can be converted to a high-resolution spectrometer. The spectrometer disperses the radiation emitted from the source in a direction parallel to the z axis of the cylindrically bent crystal; i.e., as a function of the angle φ, 1D spatial resolution is provided in a direction perpendicular to the dispersion plane. The arched character of the spectral lines recorded at the detector (the continuous red line in Fig. 7) is due to the change in the central Bragg angle θ0 for sources extended along the y axis. This spectrometer is characterized by extremely large dispersion and spatial and intrinsic spectral resolution. For illustration, by using a crystal of quartz (100) with a bending radius of 76.8 mm for detection of the Al Heα group (see the recordings of the resonance w and intercombination y lines shown in Fig. 7), the VJS provides spectral resolution at a level of 7000, a spatial resolution of about 2 µm, an average linear dispersion of 1500 mm/nm, and a collection efficiency two orders of magnitude higher than a comparable flat-crystal scheme. Two identical sets of spectra simultaneously produced by the VJS provide a high level of confidence in experimental data and also reference points for the computational reconstruction of the raw spectra. The spacing Δz′ between the recordings of two symmetrical lines represents a very sensitive parameter for identification of frequency shifts of emitted spectral lines47 that does not need the presence of supplementary reference lines (which are usually difficult to implement with the required very high precision owing to geometry-induced wavelength shifts). Therefore, the VJS appears to be currently the most suitable instrument for studies of line broadening, line shifts, and continuum lowering (i.e., phenomena that are still controversial). The precision of wavelength determination in the measured spectra depends on three factors: the fabrication and characterization of the diffraction crystal, the geometric setup and alignment of the VJS, and the data processing. The effects of these factors are analyzed in detail in Ref. 47, where examples of the successful application of the VJS are also presented. In relative measurements, where the shifts Δλ of emitted spectral lines are studied as a function of the spatially variable characteristics of the plasma source, an outstanding precision of Δλ/λ = (1–2) × 10−5 can be achieved. For example, this means that shifts of the He-like resonance line of titanium (0.261 02 nm) can be measured with a precision down to Δλ ≈ 5 × 10⁻⁶ nm that generally exceeds the current precision of standard multi-configuration Hartree–Fock code calculations. The VJS can, in principle, also be used for absolute wavelength measurements, in which case the overall precision of the spectrometer, Δλ/λ, is (5–10) × 10−4. From this point of view, the application of the VJS in advanced plasma spectroscopy is very attractive despite the more sophisticated methods required for evaluation of the experimental results and problems connected with the fabrication of the precisely bent and characterized crystals.28
Figure 7.Schematic of the vertical dispersion geometry Johann spectrometer.
We will not discuss the properties of other X-ray spectrometers based on Bragg-case diffraction from 1D bent crystals. These instruments include different variations of Johann/Johansson schemes, as well as convex,48 logarithmic spiral,49 or elliptically bent50 crystal spectrometers. General information about these instruments can be found in survey papers, e.g., Refs. 36 and 51. Instead, this section will be completed by a brief mention of Cauchois-type transmission crystal spectrometers, since these instruments are capable of covering the photon energy range up to approximately 120 keV.52 A typical scheme for a spectrometer based on Laue diffraction geometry is shown in Fig. 8. The diffraction planes are perpendicular to the surface of the crystal cylindrically bent to a radius R. Monochromatic X rays impinging on the crystal and diffracted inside the crystal slab focus near the RC; the best spectral resolution (albeit at a level of only 300) can be achieved some distance behind the RC, depending on the crystal type and the bending radius (which determine the rocking curve width), the geometric aberrations of the scheme, and spectral line broadening due to the source size and the detector pixel dimensions.53,54
Figure 8.Schematic of a transmission-crystal hard X-ray spectrometer.
Massive shielding applied in front of the crystal and at the crossover slit position protects the detector against direct impact of energetic X-rays and particles emitted from the source. The instrument can be used at very shallow angles of incidence of the radiation on the diffraction planes, and thus this type of spectrometer offers an efficient diagnostic technique for the highest-photon-energy K-shell spectroscopy and provides a powerful tool to help understand the laser energy deposition, energetic particle generation, ionization distribution, and conversion efficiency of laser radiation into X rays in plasmas produced by intense femtosecond laser pulses.
Among spectrometers equipped with 2D bent crystals, a scheme with a spherically curved crystal55 will be described in greater detail, since spherically bent diffractors offer simultaneously an outstanding combination of valuable properties (high luminosity, high spectral and spatial resolution, and relatively large spectral interval coverage). An experimental setup is shown schematically in Fig. 9. As mentioned above, in standard spectroscopic schemes utilizing bent crystals, the detector is usually placed at the intersection of the diffracted central ray with the RC, thus benefiting from the maximum spectral resolution. Assuming that Eq. (4) can be fulfilled, the maximum 1D spatial resolution is obtained in the z direction. By positioning both the plasma source and the detector outside the RC (the so-called 2D imaging mode configuration), the spectrometer provides simultaneously a slightly worse spectral and a 2D spatial resolution, i.e., a set of quasi-monochromatic 2D images of the plasma source as schematically indicated in Fig. 9. If the source-to-crystal distance p and the crystal-to-detector distance q fulfill the focal condition in the sagittal plane, the optimum spatial resolution is achieved with sagittal magnification Ms = q/p. The spatial magnification along the horizontal plane Mm = q′/p′ depends on the source distance p′ and the detector distance q′ from the RC. By choosing p = q = R/sin θ, one-to-one imaging in both directions is obtained, albeit at the cost of a considerable deterioration in spectral resolution.
Figure 9.Geometry of a spherically bent crystal spectrometer in 2D mode.
When designing the experimental configuration, several factors should be taken into account. Among them, the wavelength-dependent reflectivity of the crystals and prospective overlap of several diffraction orders are crucial. To illustrate the importance of these factors, the integrated reflectivities calculated for several strong reflectivity orders of the mica crystal (muscovite, K2O·3Al2O3·6SiO2·2H2O) spherically bent to a radius of 150 mm are presented in Fig. 10. The Rint values derived using the DIXI code28 are plotted within the span of Bragg angles practically applicable in experimental schemes providing the optimum spatial resolution [see Eq. (4)]. The wavelength range covered in the particular diffraction order follows from the Bragg law by using the refractive-index-corrected 2d values (1.9915, 0.9969, 0.6647, 0.4986, and 0.3989 nm for the mica orientations shown). Note that the mica diffraction on the plane system with 2d spacing of 1.9915 nm is usually labeled as the first order, despite its Miller indices being (002); using this convention, we show Rint for the first five orders of diffraction. Obviously, the raw spectra must be corrected with respect to Rint variation, and particular attention should be paid to data measured close to absorption edges of elements present in the crystal, in this case the K, Si, and Al K-edges positioned at 0.3436, 0.6742, and 0.7953 nm, respectively. The local extremum of Rint due to the Al K-edge is clearly visible at θ = 52.92° in the order (004), whereas the effect of the K K-edge in the reflection order (0010) close to θ = 59.47° is less pronounced.
Figure 10.Integrated reflectivities Rint calculated for five reflection orders of a mica crystal spherically bent to a radius of 150 mm.
Figure 11 presents an example of diffraction order overlap, containing transitions in H-, He-, and Li-like Cl. This spectrum was registered during an experimental campaign relevant to the shock ignition approach to inertial confinement fusion.56 A Cu target coated with 25-μm-thick Parylene-C (C8H7Cl) was irradiated by frequency-tripled beams (70 J prepulse + 160 J main beam, 0.44 µm, 250 ps, 8 × 10¹⁵ W/cm2) of the fundamental PALS laser wavelength 1.315 µm.57 Using the spherically bent mica spectrometer, the spatially resolved spectrum was registered on Kodak Industrex AA 400 X-ray film. The spectral lines diffracted in the fourth-order (H-like Cl Lyα and Heα groups, including their satellites, marked by bottom red abscissae in Fig. 11) and fifth-order (Lyβ and Heγ-η transitions, blue top abscissae) were identified via comparison of the measured data with the predictions of the SPECT3D code,10 and their intensities were recalculated according to the calibration curves presented in Fig. 10. By measuring the FWHM and relative intensities of diagnostically important Heα, Lyβ, and Heδ transitions, the spatial distributions of the ablative plasma temperature T and electron density ne were mapped. The effective values of T = 700 eV and ne = 2 × 1022 cm−3 found for the overdense plasma region are in fair agreement with predictions of hydrodynamic simulations; see Ref. 58, where the details of the spectral evaluation can also be found.
Figure 11.Overlap of H-, He-, and Li-like Cl transitions observed using the spherically bent mica spectrometer in two diffraction orders.
Another important factor frequently encountered in experiments directed at investigation of extreme-state matter is the rather harsh environmental conditions in the systems studied. The interaction of intense laser or particle beams with matter results in the production of strong radiative and electromagnetic fields, directional fluxes of charged or neutral particles, and even activation of materials that decay immediately by emitting γ rays or fission products such as β and α particles and neutrons.59 Consequently, particular attention should be paid to protection of diffractors and detectors,60 ranging from classic X-ray films and imaging plates,61 to various electronic detectors, including CCDs and pixelated detectors.62,63 This protection typically includes, among other measures, the use of strong permanent magnets deflecting the charged particles from the entrance window of the spectrometer, positioning the instruments inside Faraday cages and protective boxes consisting of combined layers of high- and low-Z elements, application of transmission filters not only protecting diffraction crystals from plasma debris but also reducing the heat load on the diffractors,64 and insertion of beam blocks and slits close to the crossover polychromatic point in order to reduce the radiative background on the detector. A combination of all these precautions permits high-quality X-ray spectra to be obtained even in experiments with PW class lasers.21
To conclude this section, we should mention that a wide variety of high-resolution X-ray spectrometers are currently available. The choice of the optimum experimental scheme depends on the particular characteristics of the system studied, on the plasma emissivity, on a combination of spectral, spatial, and temporal resolution adequate to characterize the phenomena to be investigated, and on the specific environmental conditions inside the interaction chambers (intense radiative and particle fluxes, presence of strong electromagnetic fields, etc.). Finally, the design of the experimental setup should be optimized using a ray-tracing procedure.
III. X-RAY SPECTROSCOPIC STUDIES OF HIGH-INTENSITY AND HIGH-ENERGY LASER INTERACTION WITH SOLIDS
High-energy-density physics as well as the interaction of ultra-high-intensity lasers with matter are challenging fields of research with important applications in inertial fusion science, astrophysics, planetary science, and development of unprecedented particle and radiation sources. In dense-plasma atomic physics, phenomena such as suprathermal electron generation, high radiation fields, and perturbed atomic structure (e.g., the controversial calculations of ionization potential depression65 discussed in Sec. III C) have attracted worldwide attention for decades: theory and experiments are exceedingly difficult, and independent diagnostics are of key importance for their understanding. Owing to high densities of the studied systems, advanced X-ray spectroscopy is often employed in order to minimize the effects of opacity, thereby opening a unique possibility to obtain information locally from inside the extreme-state matter.
A. Suprathermal electrons
Suprathermal electron production driven by instabilities accompanying laser–plasma interaction is of paramount interest for inertial confinement fusion (ICF) science and high-energy-density physics.66–68 In the direct drive fusion scheme, suprathermal electrons can cause degradation of the performance of the ICF capsules owing to fuel preheating and reduced compressibility of the capsule. In the fast ignition scheme,69 laser coupling to fast electrons and their subsequent transport determine the efficiency of energy delivery to the ignition region. In the shock ignition scheme,70 the fuel is ignited from a central hot spot heated by a strong spherically convergent shock. The laser intensities required to launch this shock exceed the threshold of parametric instabilities (such as stimulated Raman scattering or two-plasmon decay), which couple a significant fraction of the laser energy to suprathermal electrons. In spherical geometry experiments, the shock strength was shown to be significantly enhanced by the coupling of suprathermal electrons.71,72 Moreover, the timing of hot electron generation has become of increasing importance for the shock ignition scheme, since recent experiments have demonstrated that suprathermal electron onset has a strong influence on shock strength.73
Hydrodynamic simulations of laser–plasma interactions for pulse durations of the order of 0.1–10 ns and intensities Iλ2 = 1012–1016 W/cm2 are highly challenging, since nonlinear processes play an important role. These kinetic processes cannot be directly incorporated into large-scale hydrodynamic models because of the large disparity of temporal and spatial scales.
A detailed characterization of suprathermal electrons as well as the plasma evolution via independent methods is therefore mandatory to validate large-scale hydrodynamic approaches. In this context, X-ray spectroscopy is of particular interest owing to its potential to provide a unique characterization of suprathermal electrons.
Figure 12 demonstrates the impact of suprathermal electrons on the spectral distribution of K-shell X-ray emission from copper targets irradiated by two different wavelengths of the PALS laser.57 The spectra shown cover the spectral range starting from the Heα (1s2p1P1 → 1s2 1S0) resonance line of He-like Cu until the Kα emission of Cu1+. The spectra were recorded using a spectrometer with a spherically bent crystal of quartz (223) and X-ray film detection. The Kα1,2 emission originates from the inner-shell ionization of neutral Cu atoms and witnesses the impact of suprathermal electrons:
Figure 12.K-shell X-ray emission of copper induced by irradiating 1.5μ-thick Cu foils with the PALS kJ laser at an intensity of 1016 W/cm2 and laser wavelengths of 1.315 µm (1ω) and 0.438 µm (3ω).
Owing to subsequent electron heating, ionization proceeds toward higher charge states, which results in Kα emission of higher ionic charge states (indicated by K1L8MY in Fig. 12). Finally, even all M-shell electrons are ionized, and Kα emission is related to transitions from the L shell. While the Kα emission of the K1L8MY configurations is very close in energy for various charge states (owing to small M-shell electron screening), the Kα emission of the K1LX configurations is well separated (which reflects large L-shell electron screening). As follows from Fig. 12, non-negligible intensities are emitted from a large number of charge states (Cu27+ until Cu1+). Such a broad distribution of X-ray emission over different charge states is a typical signature of the impact of suprathermal electrons. Non-Maxwellian atomic physics simulations show18,19 that the charge state distribution of a non-Maxwellian plasma becomes very wide, while in a Maxwellian plasma, only a small number of charge states can be observed for a given temperature (typically three to five charge states). This qualitative distortion of the charge state distribution is clearly demonstrated by a comparison of spectra produced with the fundamental laser wavelength (upper spectrum in Fig. 12, indicated with 1ω) and frequency-tripled radiation (lower spectrum, indicated with 3ω).
The qualitative distortion of the charge state distribution can in turn be employed for detailed characterization of the suprathermal electrons, in particular the so-called hot electron fractionwhere ne,hot and ne,bulk are the hot and bulk electron densities, respectively. Non-Maxwellian atomic population kinetics carried out with the MARIA code18 allows determination of the hot electron fraction in hohlraums relevant to inertial fusion and to identify the relevant parametric instability responsible for hot electron generation.20
Figure 13 illustrates studies of suprathermal electron propagation in warm dense matter via high-resolution X-ray spectroscopic imaging (see Sec. II). Solid copper was irradiated at high intensities while the laser focal spot was positioned at varying distances Δx from the surface [see Fig. 13(a)]. The Kα emission spatially resolved along the z direction was observed as a function of Δx. Figure 13(b) shows the corresponding Kα emission and its spatial extension in the z direction. Empirically, we found that the Kα1 emission intensity in the z direction varies exponentially with a scaling parameter L according to IKα1(z) ≈ exp(−z/L). The parameter L therefore represents a scaling length for the decrease of the observed Kα1 emission (the integrated intensity of the Kα1 component) in the z direction. Figure 13(c), showing the dependence of L on Δ, indicates that L increases approximately linearly with Δx. Qualitatively, Kα1 emission observed for larger values of Δx is correlated with higher energies of suprathermal electrons because they have to penetrate greater lateral distances in the solid material. On the other hand, the penetration of higher-energy suprathermal electrons in the z direction is also greater, which results in larger scaling lengths L being observed for the z-resolved Kα1 emission [see Fig. 13(c)]. Note that the scaling length refers to the functional dependence and not to the absolute intensity, which will change depending on the energy of the suprathermal electrons. The opacity dependence in the Δx direction cannot be simplified to the straightforward opacity of the 8 keV Kα1 emission, because of diffusion and straggling of suprathermal electrons when they move into the solid, as indicated qualitatively in Fig. 13(a) by the red arrows. Therefore, at larger z distances, the effective path in the x direction might be different from the purely geometric value Δx of the initial focal spot position.
Figure 13.Scaling properties of suprathermal electrons propagating in solid-density warm copper visualized with 3D spectroscopic observations. Suprathermal electrons were generated by irradiating the solid copper with the fs-laser ELFIE74 at intensities of 1019 W/cm2 and variable distances Δx of the focal spot from the target edge (a). The observed spatially resolved Kα emission along the z direction (note that the color scale is not identical in individual images) for various distances Δx is shown in (b), and the dependence of the scaling length of Kα1 intensity with respect to Δx in (c).
The 3D (spectral intensity and x and z directions) experimental data thus contain complex 2D information on suprathermal propagation in a solid that can pose a challenge to forthcoming advanced atomic-physics-coupled simulations of suprathermal generation and spread in matter.
It should be pointed out that the interaction of the laser focal spot with the solid surface was been screened with the help of a stainless steel cone [Fig. 13(a)] in order to avoid suprathermal electron propagation outside the target surface. By using similar intricate experimental designs, the application of spatially resolved high-resolution X-ray imaging techniques is capable of providing critical local data from the plasma created inside the targets.
B. Colliding plasmas
The hydrodynamic description of colliding and intermixing plasma phenomena is a challenging field with important applications in astrophysics and multi-beam laser-produced plasma experiments. Studies of counter-propagating and stagnating laser-produced plasmas are motivated by numerous applications. Knowledge of the relevant processes is important for the design of ICF pellets, for optimization of X-ray laser media, and for investigation of energy dissipation and evolution of instabilities in plasmas, thermalization of counter-streaming plasma plumes, creation of plasma jets, and formation of quasimolecular structures.75 Applied problems include interaction of plasma jets with residual gas in interaction chambers, charge-exchange processes, and collisions with secondary targets (e.g., reactor walls).
Figure 14 demonstrates the application of X-ray imaging spectroscopy to the study of the interaction of highly ionized accelerated plasma outflows with cold gases.76 In Fig. 14(a), X-ray pinhole images of plasma jets produced in laser-irradiated aluminum foil are presented. When the laser irradiates the thin aluminum foil (with laser direction from right to left), first a plasma jet is formed that is directed toward the laser. Afterwards, the foil burns through and a second jet propagating along the direction of the laser beam is created. Hydrodynamic simulations estimate the velocity of both jets to be of the order of 107 cm/s.
Figure 14.X-ray imaging of plasma jets accelerated when irradiating Al foil with the PALS kJ laser. Plasma jets penetrate into the ambient cold gas (air) at a pressure of 19 Pa, thereby inducing a rich spatial and wavelength-dependent structure in the emitted X-ray spectra.
Figure 14(b) shows the variations in the spectrally and spatially resolved emission of jets ejected from the front and rear sides of the target. For example, a rich spatial and spectral structure of the Lyγ line observed at the rear side shows maxima and minima that are absent in the front-side emission. Moreover, intercombination satellite lines show no rear-side emission near the target surface and increased emission far from the target. These variations witness the complexity of the interaction of highly ionized plasma jets with ambient matter, which cannot be described satisfactorily by state-of-the-art hydrodynamic simulations. In this sense, X-ray spectroscopy provides critical data for benchmarking future plasma codes.
A particular difficulty faced by state-of-the-art simulations is related to the intermixing phenomena of colliding plasmas of different types and ionization stages. Experimental data show very well characterized emission features during the penetration process [see Fig. 14(b): jets on the rear side]: there are maxima and minima of Lyδ and Lyγ in the jets, as well as a dramatic increase in intensity of forbidden intercombination satellite transitions that are usually of too low intensity to be observable. The complexity of these emission features is related to charge exchange coupling between the partially ionized ambient gas and the highly ionized plasma jet. This is a very complex atomic physics phenomenon that hitherto has been solved adequately only in the framework of coupling between a neutral background and impurities in magnetically confined fusion plasmas.77–80 Corresponding hydrodynamic simulations of dense laser-produced plasmas would require not only implementation of extended atomic physics codes (because the charge exchange coupling proceeds via highly excited states in different spin states,76 which cannot be handled using the averaged atom approach) but also inclusion of charge exchange coupling between different sorts of plasmas. Such codes are currently not available.
Various mechanisms of energy transfer in colliding plasmas, e.g., ion deceleration and stopping,81 shock-wave generation,82 formation of highly excited Rydberg states83 or hollow atoms with multiple inner vacancies,84 charge transfer processes,85 and ion neutralization83 need to be studied under well-defined environmental conditions with the smallest possible perturbations introduced by 2D effects in strongly nonhomogeneous media with variable macroscopic parameters. In particular, the accelerated plasma particles should form high-aspect-ratio jets with suppressed lobes, which might result in intriguing spatial gradients capable of completely masking the investigated phenomena.
The main mechanisms decisive for plasma jet formation and propagation include confinement of the plasma flow by the surrounding medium, lowering of the internal thermal pressure due to radiative cooling, and possible suppression of plasma radial expansion by magnetic fields.86 Particular care should be taken in the design of jet production in experiments with colliding plasmas. For example, proven schemes for collimated jet production in double-foil target experiments86 are shown in Fig. 15. The jets are created at the front and rear sides of foil irradiated by the focused laser beam with a slightly annular profile. In the first case [Fig. 15(a)], the target is irradiated by one (main) or two (main and auxiliary) beams at normal incidence on the foil. The role of the auxiliary beam is to create a jet expanding against the plasma plume generated by the main beam on the rear side of the primary target (in this case Al foil); thus this scheme provides favorable conditions for the study of collisions of counter-streaming plasmas. However, we emphasize that even if only the main beam is used, the transmitted laser light (albeit partly attenuated owing to interaction with the primary foil) propagates coaxially with the plasma jet ejected from the rear side of the foil; i.e., the jet does not interact with the non-perturbed secondary target but with the pre-plasma created near its surface. In contrast, with oblique laser incidence onto the thin foil [Fig. 15(b)], the plasma jet propagates again practically normal to the primary foil and interacts with the fresh surface of the secondary target. Consequently, the interaction conditions are better defined and the spectroscopic experiment provides non-distorted information on relevant phenomena.
Figure 15.Plasma jet production at normal (a) and oblique (b) laser incidence on thin Al foil. Even in the latter case, the jet propagates in a direction perpendicular to the foil surface, and this jet is used in investigating trapping of the highly charged Al ions on the secondary target surface (c).
The VJS-recorded spatially resolved spectrum shown in Fig. 15(c) demonstrates ion deceleration and trapping at the solid material. The ions produced from oblique incidence of the laser on the 0.8-μm-thick Al foil impinged on a secondary Mg target positioned at a distance of 550 µm, and the interaction was investigated via the X-ray self-emission of H-like Al ions. Spectral analysis relates a distinct blue Doppler shift (the dot-dot-dashed line) of the Al Lyα resonance line close to the Mg foil to the gradual monotonic deceleration of Al ions from their maximum velocity ∼5 × 107 cm/s to their full stopping at the Mg surface.86
Another important application of directional flows of well-collimated energetic ions produced with exploding foils (i.e., thin foils fully ablated by the laser during the pulse duration) is to the spectroscopic investigation of transient phenomena accompanying the interaction of plasma with surfaces of solid targets (generally known as plasma–wall interaction, PWI). The plasma-facing materials of present-day experimental fusion reactors experience particularly hostile environmental conditions, and a detailed knowledge of various mechanisms of energy transfer, material erosion, and migration in the near-wall region, including ion deceleration and stopping, shock-wave generation, formation of highly excited Rydberg states or hollow atoms with multiple inner vacancies, charge transfer processes, and ion neutralization, are of primary importance for the design of modern reactors. An example of the spatially resolved spectra contributing to identification of charge exchange phenomena accompanying the PWI87 is presented in Fig. 16. In experiments performed with frequency-tripled radiation (438 nm) of the PALS iodine laser, a single laser beam was focused onto a primary, jet-producing target (0.8-μm-thick Al foil) at an angle of 30° from the target normal. A secondary quasi-massive C target (250-μm-thick pyrolytic graphite foil) was positioned at a distance of 590 µm. Expansion of the plasma jets produced at both front and rear surfaces of the Al foil was visualized via Lyγ and Lyδ emission of the H-like Al. The spectra were observed tangentially to the Al foil surface using the VJS. The three zones marked in Fig. 16 are characterized by significantly modified profiles of the spectral lines recorded using the VJS. In zone I, the emitted lines display distinct Doppler shifts due to directional reversal of the plasma jets outflow at opposite sides of the burnt-through Al foil. In zone II, the plasma propagates in a laminar flow, and no large-scale plasma turbulence is visible. With increasing distance from the primary target, the intensity of the observed Al Lyγ emission gradually decreases, but then it again intensifies in zone III. The enhanced emission close to the C surface indicates deceleration, trapping, and subsequent dissipation of Al ions at the secondary target. The local depressions (dips) observed in highly resolved Al Lyγ profiles near the C foil represent the spectroscopic manifestation of charge exchange phenomena in the PWI.87
Figure 16.Spatially resolved spectra of Al Lyγ and Lyδ self-emission from a laser-irradiated double-foil Al/C target. The laser strikes the primary Al-foil target at oblique incidence from below.
For a survey of further spectroscopic experiments with laser-produced colliding plasmas, we refer to Ref. 81 and references therein.
C. Line shapes and group shapes
Single line shapes have traditionally been used for Stark broadening analysis and subsequent density diagnostics.4 In high-energy-density physics, Stark broadening analysis is rather challenging. In strongly coupled plasmas, dielectronic satellite accumulation contributes considerably to the apparent resonance line emission,88,89 and there are even situations where resonance line emission disappears90,91 and only satellite emission is observed. Therefore, under realistic conditions of dense laser-produced plasmas, analysis of the full emission structure is mandatory. This has given rise to increased interest in assessment of the role of dielectronic satellite transitions even in the case of Stark broadening analysis.92
In typical experiments with high-intensity laser-produced plasmas, the environmental conditions are characterized by an enormous radiation load, and, despite the careful precautions that are taken, acquisition of high-quality spectra is very demanding. At present, detailed line shape analysis of spectra emitted from PW class laser-produced plasmas is an extremely difficult task, and interpretation of the overall group shape and group shift of satellite transitions seems to be more promising. In this respect, transitions that originate from so-called hollow ions (e.g., transitions of the type ) have attracted particular attention owing to their favorable opacity properties:17 owing to the absence of both K-shell electrons, the ground-state opacity is related to an excited autoionizing state that is weakly populated even in high-density plasmas.
Stark broadening calculations for satellite transitions are complex owing to the large number of atomic states involved. In addition, interference effects between the states may lead to considerable group narrowing.16,80Figure 17 demonstrates the impact of these effects on the dielectronic satellite spectra and of aluminum. Obviously, interference effects become very strong in near- and above-solid-density matter [see the order-of-magnitude difference in electron densities corresponding to Figs. 17(a) and 17(b)].
Figure 17.Impact of interference effects (IFE) on the Stark broadening of dielectronic satellite X-ray spectra emitted from 1s2l2l′ and 1s2l3l′ excited states of aluminum. In near-solid-density matter, interference effects result in a crucial emission group narrowing.
Line shift or group shift measurements represent another important group of experiments to be performed at PW class lasers. Despite theoretical and experimental progress achieved in understanding spectral line shifts in hot dense plasma,93–101 these phenomena remain a subject of controversy. In most theories, an excess of free plasma electrons around the ionic radiator results in perturbations of the bound electron levels and wavefunctions, the emitted X-ray lines are broadened, and their wavelengths are shifted to the red. A rigorous description of the line shifts requires detailed evaluation of the shift-width operator involving static and dynamic contributions.93 The quantum mechanical impact approach94 and self-consistent field ion sphere models65 have provided reasonable agreement with measured data, but they still show discrepancies for transitions related to high-n quantum levels.95Table I presents a selection of line-shift data measured at laser-irradiated Al targets in various experiments, together with the results of the analytical finite-temperature ion sphere model OEFTIS.65
Transition
References 89 and 92
Reference 90
Reference 94
Reference 95
Heα
2.2 ± 0.6/1
…
…
2.4 ± 0.3/1.9 ± 0.7a
Heβ
…
20 ± 8/25
6 ± 2/6.8
…
Lyα
…
3.7 ± 0.7/4.1
…
…
Lyβ
0.2 ± 0.1/0.3
…
…
…
Lyγ
0.5 ± 0.2/0.76
…
…
…
Lyδ
1.1 ± 0.2/1.1
…
…
…
Lyε
2.0 ± 0.5/2.4
…
…
…
Table 1. Line-shift measurements in units of 10−10 m (first values) and OEFTIS calculations (second values) of H-like and He-like aluminum lines in dense laser-produced plasmas. Heα measurements have been performed at ne = 2.2 × 1022 cm−3, kBTe = 400 eV (Ref. 98) and at ne = 2.2 × 1023 cm−3, kBTe = 330 eV (Ref. 101), Heβ measurements at ne = 8 × 1023 cm−3, kBTe = 220 eV (Ref. 96) and at ne = 5 × 1023 cm−3, kBTe = 560 eV (Ref. 100), Lyman series measurements at ne = 1.5 × 1022 cm−3 and kBTe = 1400 eV (Ref. 95), and Lyα measurements at ne = 5 × 1023 cm−3 and kBTe = 280 eV (Ref. 96).
While the existence of frequency shifts in experiments with sub-nanosecond laser-produced plasmas has been widely accepted,95,96,99 observations of large redshifts in short-pulse laser-produced plasmas at solid density96,100,101 have sometimes been questioned, particularly because of the occurrence of significant high-order satellite emission overlapping the resonance lines and the associated uncertainties introduced by the wavelength markers. Table I demonstrates generally good agreement between the observations and the OEFTIS calculations, except for the Heα transitions. As the contributions of high-order satellites have been extracted via a complex genetic algorithm code,102 the remaining discrepancies might be ascribed to radiation transport effects in differentially moving plasmas,19 which lead to significant Heα line asymmetries (and therefore to line-center shifts). Note that the OEFTIS model likewise allows estimation of line disappearance due to strong ionization potential depression (merging the bound levels with the continuum).65
To shed light on these experimental aspects, precise spectroscopic observations of K-shell emission from highly stripped Al ions immersed in dense, constrained-flow laser-produced plasma98 are presented in Fig. 18. The Heα spectra were emitted from a 20-μm-thick Al strip sandwiched in between two 25-μm-thick plastic substrates. A laser beam focused to a diameter of 80 µm was incident normally on the target, the surface of which was cut perpendicular to the layered structure. The VJS spectrometer collected the X-ray emission at an angle of 2° to the target surface. In this geometry, the aluminum plasma was kept in a constrained flow perpendicular to the direction of the spectral observation; i.e., the effects of lateral plasma expansion were limited. The electron density and temperature can reach values close to 5 × 1022 cm−3 and 100 eV, respectively, inside the crater created on the irradiated target surface.103 The spatially resolved spectral traces shown in Fig. 18(a) gradually broaden and shift to longer wavelengths with decreasing distance from the original surface of the irradiated sandwiched target, i.e., with increasing electron density and decreasing temperature of the laser-produced plasma. Owing to the strong satellite emission overlapping the parent lines, the distinct redshifts of the observed profiles cannot be directly identified as frequency shifts of the resonance w and intercombination y transitions. The rigorous evaluation of these shifts was based on hydrodynamic simulations of the plasma conditions, on the prediction of the Al Heα group satellite structure,18 and on application of the genetic algorithm code GASPED102 for the decomposition of complex profiles into individual spectral components. The maximum shift of the Al Heα resonance line w (0.775 68 nm) observed at the target surface was about 2.2 × 10⁻⁴ nm. Note that these spectra were measured using the VJS (Fig. 7); thus the problems with the wavelength markers were eliminated by simultaneous production of two mirror-symmetric spectra. In any case, when collecting precise spectroscopic data suitable to validate codes predicting spectral line shifts in hot dense plasmas, all these factors should be taken into account.
Figure 18.(a) Spatially resolved traces of Al Heα spectra observed as a function of the distance from the surface of a laser-irradiated composite target. (b) The spectrum emitted from the surface of 20-μm-thick Al foil sandwiched between two plastic substrates was decomposed into resonance w, intercombination y, and satellite components using genetic algorithm code fitting.
Interpretation of demanding experiments directed at precise evaluation of resonance line shifts is hampered by line overlap with satellites, by radiation transport (see below), and by the necessity to apply sophisticated atomic physics codes. Given these problems, the agreement between experimental and theoretical data is satisfactory. On the other hand, the application of modern spectroscopic methods combined with a better diagnosis of macroscopic parameters of plasma systems opens new horizons for further investigation of these fine spectroscopic features, which serve as an important test bed for atomic physics models.
D. Signatures of strong electromagnetic fields
The properties and applications of ionized matter depend strongly on the presence of electromagnetic fields within plasma. At lower laser intensities, the effects of magnetic fields are usually less pronounced, and thermal and nonthermal electric fields occurring in plasmas are generally studied by analysis of the Stark-broadened profiles of emitted spectral lines.4 Single-frequency electric fields associated with collective motion of plasma particles, i.e., plasma waves, or with externally introduced (typically laser) fields may modify the energy level structure and result in the appearance of local extrema, dips, and/or peaks in spectral line profiles or in the appearance of satellite lines close to these transitions.104 A survey of theoretical and experimental research in this field can be found in Refs. 105 and 106.
In situations where magnetic field effects cannot be neglected, the more complicated Stark–Zeeman spectral line shape codes107,108 must be applied when interpreting the experimental observations. In general, the presence of magnetic fields increases the complexity of calculations, but their effects on the shape of the observed spectral lines (consisting in a partial polarization of the emitted radiation, additional line splitting, and a bending of the colliding electron trajectories into helical paths along the magnetic lines of force) may be crucial. This is demonstrated in Fig. 19, where the predictions of a pronounced Stark–Zeeman effect due to the interaction of variable-intensity laser light (of wavelength 0.94 µm and with the beam linearly polarized in the direction of spectral observation) with H-like Kr are shown.109
Figure 19.Simulations of Kr Lyα emission (13 429/13 509 eV) modified by a variable-intensity, linearly polarized laser beam. Figure provided courtesy of E. Stambulchik.
The striking variations in Kr Lyα group profile offer a novel approach to diagnostics of electromagnetic fields inside the plasma but, at the same time, also a unique possibility to measure the extreme focused femtosecond laser intensities at newly built facilities. The application of this diagnostic technique to ultrashort laser pulse interaction with different-Z targets is, however, limited by several factors.109 In particular, these include the natural linewidths of relevant lines, the spectral resolution of available instruments, the existence of sufficiently large plasma volumes containing desired ionic species the upper excited states of which are not depopulated by field ionization, and the overlap of the field-perturbed and unperturbed emission106 from different-parameter plasmas (which are always present owing to the temporal evolution of the studied system). This means that in addition to the high spectral and spatial resolutions of the spectrometer used, some temporal resolution introduced either by the instrument itself or by a sophisticated structure of the irradiated targets is also desirable. The design and realization of such experiments is very difficult, but at the same time they represent an important challenge.
E. Dense-plasma atomic physics
Figure 20 demonstrates the potential of high-contrast high-intensity lasers to contribute to the challenging field of dense-plasma atomic physics. A Nd-glass laser with pulse duration 400 fs, energy 1 J, wavelength 0.53 nm, focal spot diameter 10 µm, and intensity 5 × 10¹⁸ W/cm3 was brought to interaction with a solid magnesium target at normal incidence for different irradiation conditions: (1) high contrast 1:1010 (solid blue curves) and (2) a prepulse with energy 0.03 J separated from the main pulse by 150 ps (solid black curves).110
Figure 20.K-shell X-ray emission of magnesium irradiated with different laser conditions, using either a beam with extremely high contrast 1010–1011 or preceded by a prepulse. (a) Comparison of high-contrast and double-pulse spectra of Heβ until Lyβ. (b) Comparison of high-contrast and double-pulse spectra of Heα and satellite emission. The MARIA simulations indicate near solid density ne ≈ (3–4) × 1023 cm−3, temperature kTe ≈ 0.2–0.3 keV, and expansion velocities of the order of V ≈ 3 × 107 cm/s. The expansion velocity combined with radiation transport results in a characteristic steep rise in the Heα-intensity on the blue line wing (see the red arrow).
Figure 20(a) shows the spectral window containing the He-like resonance lines Heβ = 1s3p1P1–1s2 1S0, Heγ = 1s4p1P1–1s2 1S0, Heδ = 1s5p1P1–1s2 1S0, the H-like Lyβ = 3p2P1/2,3/2–1s2S1/2 lines, and the Li-like dielectronic satellites 1s3l3l′ and 1s2l3l′, while in Fig. 20(b), the spectral interval of Heα and satellites is shown. In the case of a prepulse, the resonance line emission is dominant and the dielectronic satellite intensities are relatively low. At high contrast, however, the situation is dramatically different. A new type of spectrum develops: resonance lines seem to disappear, and the dielectronic satellites become the most pronounced emission features in the spectrum. This phenomenon is known as dielectronic satellite accumulation (DSA) and has been interpreted in Refs. 88–90. Figure 20 also shows simulations carried out with the MARIA code,16,18,19 indicating the presence of near-solid-density plasmas: electron density , electron temperature kTe ≈ 0.2–0.3 keV, and expansion velocities of V ≈ 3 × 107 cm/s. The high density results in a high ion–ion coupling parameter (Γ ≈ 3) and manifests itself in a strongly developed DSA88–90,110 line broadening, line shift, and line disappearance, while the expansion velocity is responsible for the steep rise in Heα intensity on the blue wing [see the arrow in Fig. 20(b)] induced by asymmetric radiation transport in the expanding plasma.19,110
Of particular interest for dense-plasma atomic physics is the continuum edge shift of He-like ions near 0.75 nm and the line disappearance of Heδ and even Heγ. These measurements provide critical data for theoretical modeling of the ionization potential depression that is still a subject of much controversy: see Refs. 65, 80, and 111 and the discussion in Sec. III C above concerning Table I and the references therein.
Figure 20 demonstrates that the interaction of high-contrast lasers with targets changes significantly the observed spectral distribution (compare the black spectra recorded using the prepulse with the blue ones from the high-contrast case). In this respect, PW class lasers represent powerful tools to study near-solid-density heated plasmas via high-resolution X-ray spectroscopy.21
Interaction of ultra-high-intensity (UHI) lasers with matter may also induce important parameter changes via production of suprathermal electrons and variation of environmental conditions depending on the target design, as demonstrated in recent PW experiments with nanowire targets;112 see Fig. 21. Comparison of the electron energy distribution functions for flat and wire targets shows that nanowire surfaces significantly increase the suprathermal electron fraction and temperature. Obviously, these targets may significantly change the non-Maxwellian character of the dense laser-produced plasma in the MeV energy domain. As can be seen from extrapolations of the hot-electron distribution Ne to lower energies (below 0.5 MeV), the fitting curves cross each other in the gray area. As this area extends into a potential domain of high-resolution X-ray spectroscopy, it is currently an open question as to what changes in the domain of about 10–100 keV hot-electron temperature are implied if dramatic changes in the MeV domain are observed.
Figure 21.Distribution function of high-energy electrons observed in PW laser experiments with bare foil (blue lines) and nanowire-coated (red) targets. Owing to the line crossing at lower energies, this energy region represents a very interesting domain for potential X-ray spectroscopic observations. Suprathermal electron populations have been recorded with an electron spectrometer collecting the electrons escaping from the front side of the target.
Here we emphasize that X-ray spectroscopy characterizes suprathermal electrons via modification of spectra emitted from inside the plasma,18,20 while suprathermal electron spectrometers collect the electrons escaping from the plasma. Consequently, space charge effects may also influence the number of recorded electrons, particularly in the lower-energy range. The detailed X-ray spectroscopic studies of the Kα spectral distribution described in the context of Figs. 12 and 13 should therefore shed more light on the phenomenon of local suprathermal electron generation in dense PW laser-produced plasmas.
F. Test-bed laser-produced plasmas: Quasi-stationary conditions, tracer elements
An adequate characterization of the thermodynamic environment is mandatory to allow comparison of experimental data with dense-plasma atomic theory. This is particular important for femtosecond laser-produced plasmas: in most cases, neither the charge state nor the electron distribution can be assumed to be in equilibrium. Consequently, theoretical analysis of femtosecond laser-produced data requires the application of complex reconstruction methods that by themselves introduce considerable error bars in the analysis. This holds true not only for optical femtosecond lasers but also for X-ray free electron lasers (XFELs).
From an atomic physics point of view, a favorable situation occurs when the quasi-stationary condition is fulfilled: the evolution time scale for characteristic changes in plasma parameters is large enough to guarantee that the ionic system is able to follow and to achieve approximately stationary conditions during the temporal evolution of the system. Theoretical analysis shows16,18,80 that the quasi-stationary conditions are related to the so-called confinement parameterwhere τplasma is the plasma confinement time, which can be estimated roughly as the laser pulse duration τlaser, D is the dielectronic recombination coefficient, R is the radiative recombination coefficient, I is the ionization coefficient, and neT is the three-body recombination rate coefficient. Numerical analysis shows that for the K-shell, the confinement parameteris almost independent of temperature and density in the relevant parameter domains.18
This means that quasi-stationary conditions for K-shell X-ray spectroscopy are fulfilled for neτplasma > 3 × 1011 cm−3 s. For example, at τplasma = 1 ns, we need an electron density ne > 3 × 1020 cm−3 (which is comparable to the critical plasma density for typical laser wavelengths) in order to achieve quasi-stationary conditions. This is exactly why kilojoule laser installations with nanosecond pulse duration are of outstanding interest for research: they permit the achievement of quasi-stationary conditions owing to the high critical density, nanosecond time scale, and high energy contained in their beams, allowing access to intensities up to 1017 W/cm2. At these intensities, suprathermal electron generation is important for the system behavior and, at the same time, it can be investigated with X-ray K-shell spectroscopy under quasi-stationary conditions. Such studies are very important for high-energy-density research and fusion science, where typical laser intensities fall within the interval of 1013 – 1017 W/cm2.
X-ray spectroscopy in this parameter domain is of great interest, since large-scale hydrodynamic simulations that incorporate nonlinear plasma interaction (e.g., stimulated Raman scattering, SRS, and two-plasmon decay, TPD) are highly challenging owing to the large disparity of temporal and spatial scales.113 Spatially resolved X-ray spectroscopy therefore provides important critical data to benchmark the complex simulations,114 because the spectral distribution of inner-shell X-ray transitions as well as the ionic population are sensitive to the fraction of hot electrons.18
With regard to experiments with femtosecond PW class lasers, these are capable of recording X-ray signatures at very high densities (see Fig. 20). However, the realization of experiments at near quasi-stationary conditions depends on the maximum achievable density. In particular, particle-in-cell (PIC) simulations indicate that irradiation of nanostructured targets by high-intensity femtosecond-duration laser pulses provides a wide variety in the parameters of the systems studied. For instance, 2–3-dimensional PIC simulations indicated that irradiation of nanowire targets with PW class lasers might result in much-above-solid-density compressed plasmas.112 Assuming an electron density of 1025 cm−3, quasi-stationary conditions might be achieved even on time scales of some 10 fs. Investigation of systems with densities considerably exceeding solid density combined with quasi-stationary conditions is of outstanding interest for dense-plasma atomic physics. From this point of view, further development of nanostructured targets and their application in PW laser-produced plasma experiments are also of paramount interest for advances in atomic physics.
G. Radiation fields induced by PW lasers and hollow ion x-ray emission
Figure 22 shows the X-ray emission of aluminum recorded in a PW class laser experiment.21 This spectrum demonstrates that even under the harsh conditions of high-energy, sub-picosecond laser–matter interaction, high-quality spectroscopic data can be recorded using spherically bent Bragg crystals. The strong spectral emission between Lyα and Heα lines is attributed to radiative transitions in hollow ions of the typeThe origin of this strong hollow ion emission is still under discussion, but is presumably related to a combination of suprathermal electron impact and high-radiation-field effects. Further theoretical and experimental studies are required to shed more light on the hitherto unexplained intense emission of hollow ions in optical laser-produced (but also dense Z-pinch) plasma experiments.17 The impact of radiation fields on hollow ion emission has also been studied in the framework of XFEL interaction with matter, which will be considered below.
Figure 22.K-shell X-ray emission from 1.5-μm-thick aluminum foil irradiated with a 160 J, 0.7 ps, 1.064 µm PW laser beam at I = 3 × 10²⁰ W/cm2. Strong hollow ion emission between Lyα and Heα is observed.
A. The x-ray radiation field as a controlled parameter
The interaction of XFEL radiation with matter provides new horizons for realization of supplementary studies in high-energy-density physics, in particular owing to the possibility of controlling radiation fields that are intense enough to redistribute atomic populations even in isoelectronic sequences.16
B. Hollow crystals
Typical XFEL intensities at some keV photon energy imply photon densities of the order of solid density16where erf(x) is the error function. For example, for IFEL,δE,τ = 1017 W/cm2 and EFEL = 2000 eV, we obtain . Therefore, considering a very narrow XFEL beam (light pencil), one photon falls on practically every atom in the lattice structure. With X-ray pulse durations of the order of (or even smaller) the characteristic Auger time scale, the irradiation of solids with an XFEL allows sudden photoionization of the inner shells for most of atoms in the lattice. Consequently, almost every atom is transformed to an autoionizing state, followed by a massive burst of Auger electrons on a time scale of some 10 fs.
Figure 23 schematically illustrates these processes and the subsequent evolution. At the beginning of the interaction, the high-intensity XFEL beam interacts with the solid and creates a photoelectron in almost every atom. Therefore, most of atoms have lost one electron from the inner shell, thus leading to the creation of a very exotic state, a dense hollow crystal. Owing to the core hole vacancies, the hole states are autoionizing and decay on the Auger time scale of some 10 fs. Consequently, the hollow crystal is a very short-lived exotic state of matter.
Figure 23.Cartoon of hollow crystal formation due to XFEL irradiation of a solid.
C. A new role of atomic physics processes: Auger electron and three-body recombination heating
As demonstrated by Eq. (11), almost every atom in the lattice structure is affected by the creation of photo- and Auger electrons. Therefore, these electrons also have near solid density. The photoelectrons have kinetic energy Ephoto given by the difference of the XFEL photon energy EXFEL and the ionization energy Ecore of the core electron, i.e.,while the Auger electrons have characteristic energies that correspond to the dielectronic capture energy. The photoelectron kinetic energy can therefore be close to zero if the XFEL is tuned exactly to the ionization energy. This is distinctly different from the Auger electrons, which have kinetic energies corresponding to the capture energy, which is independent of the photon energy (if the photon energy exceeds the ionization energy needed to create a core hole state). As the capture energy of core hole states is of the order of , the Auger electron kinetic energy is very large, being of the order of the core hole ionization energy. Therefore, Auger electron kinetic energy makes an important contribution to material heating in XFEL solid–matter interaction.115,116
Owing to the high density, Auger and photoelectrons equilibrate rapidly with “cold” conduction band electrons (on a 1–10 fs time scale), thereby creating a common “bath” of dense electrons with temperature much less than the original kinetic energies. Therefore, efficient three-body recombination into the original hole states can take place from this bath of dense electrons. On the other hand, three-body recombination between the atom/ion and the two continuum electrons with energies E1 and E2 transfers back the ionization energy Ei to the continuum electron with energy E, i.e.,The three-body recombination influences the heating of dense matter,117 as indicated in Fig. 23. Thus, the well-known elementary processes of photoionization, autoionization, and three-body recombination contribute directly to material heating and attribute a new role to elementary atomic physics cross sections in XFEL-induced material heating.
To study and validate the various heating mechanisms with independent methods, high-resolution spectroscopic studies have been undertaken115 in the framework of the first high-energy-density experiment at the FLASH XUV-FEL.118Figure 24 shows the experimental spectrum of aluminum emitted in the spectral range from 12 nm to 20 nm. The blue curve in Fig. 24(a) shows a simulation of the Ne-like transitions of Al IV. Comparison of the data (black curve) with the simulations (blue curve) identifies the principal transitions near 16 nm that originate from the resonance transitions , but shows strong discrepancies near 13 nm, where the resonance transitions are potentially located. Systematic discrepancies are also observed on the red wings of both types of resonance transitions [indicated by red arrows in Fig. 24(a)]. Atomic structure calculations show that the experimentally observed features on the red wing of the 3s- and 3d-resonance transitions near 13 nm and 16 nm can be attributed to Na-like [red dashed curve in Fig. 24(b)] and Mg-like [red solid curve in Fig. 24(b)] dielectronic satellite transitions of the type and , respectively. Taking into account these satellite transitions results in perfect agreement with the data, as demonstrated in Fig. 24(b).
Figure 24.MARIA code simulations of the XUV spectra induced by XUV-FEL interaction with solid aluminum. (a) Simulations taking into account only the Ne-like transitions K2L7M1–K2L8 (blue solid curve). (b) Simulations taking into account the Ne-like transitions K2L7M1–K2L8 as well as transitions from dielectronic satellites of Na-like (red dashed curve) and Mg-like (red solid curve) aluminum, K2L7M2–K2L8M1 and K2L7M3–K2L8M2, respectively.
The simulations show that the spectral distribution of these Na- and Mg-like satellite transitions is very sensitive to electron temperature. Figure 25 demonstrates the temperature sensitivity of the Na-like satellites. The best fit to the data from Fig. 24(b) is obtained for kTe = 25 eV ± 10 eV. An intriguing point regarding the use of the Na-like and Mg-like dielectronic satellite transitions is that their corresponding upper states are autoionizing, with very large Auger rates to ground and excited states.119 Therefore, the characteristic time of photon emission τji is very short, since it is dominated by the Auger ratesConsequently, the corresponding emission is closely related to the instants of XUV-FEL interaction with the near-solid-density matter. It is important to note that for temperature determination, only the spectral distribution of the Na-like and Mg-like dielectronic satellites has been used, while the intensity contribution from the Ne-like resonance lines [blue curve in Fig. 24(a)] is only taken into account to obtain the correct contribution from the Na-like and Mg-like satellites. In fact, the simulations demonstrate that the Ne-like resonance contributions exhibit emission at about 8 eV, which is significantly lower than the temperature obtained from the satellite contribution.115 The resonance line intensities also have contributions from the low-density low-temperature recombination regime, because their radiative decay rates are of the order of 109–1011 s, indicating self-emission about 0.1 ns after interaction, i.e., long after the pulse duration.
Figure 25.MARIA code simulation of the spectral distribution of Na-like dielectronic satellites K2L7M2–K2L8M1 of aluminum, depending on the electron temperature.
D. Pump probe geometries and hollow ion x-ray emission
Figure 26 shows the MARIA code simulations for a pump probe situation, which means that the XFEL beam is interacting with a heated dense plasma. The plasma is assumed to have constant temperature and density (because the femtosecond interaction times characteristic of experiments using the XFEL beam are very short compared with the evolution time scale of the usual optical nanosecond laser-produced plasmas) in order to demonstrate the principal mechanisms of hollow ion X-ray emission. The origin of this emission is explained by subsequent K-shell photoionization.16,120 The hollow ions can be excited to an observable level by the initiation of an effective photoionization chain reactionand used as effective X-ray emission switches owing to the 10 fs autoionization time scale.121 Note that the fully time-dependent simulations carried out with the MARIA code16,18,122,123 do not contain any free parameters. The excitation mechanism is therefore well identified as the chain-reaction-induced photoionization of the K shell by intense radiation fields. This can be seen from a comparison of the solid curves, where all photoionization channels are included, and the dashed curves, where the photoionization channel (17) is artificially switched off. The very low emission intensities of hollow ions shown by dashed curves are due to residual collisional–radiative effects in the dense low-temperature plasmas. The XFEL-driven hollow ion emission predicted by the MARIA code simulations for magnesium120 has since been observed in experiments at the SLAC LCLS installation.124 The overall agreement of simulations with experimental data is excellent, including the predicted high intensity of the hollow ion emission. Recently, a combination of photoionization and resonance excitation has also been identified as a supplementary channel of hollow ion emission:17
Figure 26.MARIA code simulation of the temporal evolution of hollow ion X-ray emission induced via K-shell photoionization driven by intense XFEL irradiation of a dense aluminum plasma at ne = 1021 cm−3 and kTe = 30 eV in a pump probe configuration. Solid and dashed lines correspond to simulations with photoionization from K1 switched on and off, respectively.
Similar experiments with controlled radiation fields might provide the complementary information needed to finally resolve the mystery of hollow ion emission in dense optical laser-produced plasmas.17
E. Dense-plasma effects on atomic structure
Another controversial field studied at XFEL installations is ionization potential depression.124 The experimental data are in excellent agreement with the recently developed atomic-solid-plasma (ASP) model,65 whereas earlier models, such as the well-established model of Stewart and Pyatt125 failed to match the data. Moreover, a report126 claiming good agreement between the data and Ecker–Kröll theory127 could not be confirmed,65 since the Ecker–Kröll model had been artificially supplemented with the use of a fitting parameter126 to match the data, and an accidental coincidence in the Ecker–Kröll scaling and atomic structure scaling of Hartree–Fock core-shell energies had been overlooked.65
Finally, we note that owing to the short time scale (some 10 fs) of the XFEL pulses, the radiative emission from the XFEL-irradiated targets is not in equilibrium. However, owing to the short femtosecond time scale, the data are usually time-integrated (the temporal resolution of current X-ray streak cameras reaches only about 0.5–1 ps). To compare the data with simulations, the predicted temporal evolution of the emitted radiation has to be summed.17,119 The validity of this approach is conditioned by a strongly model-dependent procedure (cf. also Fig. 24). At present, the question remains open regarding the extent to which XFEL experiments might actually contribute to particular topics in dense-plasma atomic physics that are a priori better explored in high-density experiments with plasmas near thermodynamic equilibrium or at least with dense plasmas at near quasi-stationary conditions.
V. CONCLUSIONS AND COMMENTS
The paper has surveyed the exceptional potential of high-resolution X-ray spectroscopy to contribute to understanding the interaction of matter with high-intensity high-energy laser radiation. This approach might also serve as a primary source of information for fundamental studies of the atomic physics of dense correlated charged particle systems. A variety of Bragg-type X-ray spectrometers and crystals have been discussed with respect to their spectroscopic diagnostic applications and in particular their applications in harsh experimental environments, such as those encountered in laser–matter interaction using PW class lasers. While maintaining high collection efficiency, focusing schemes based on high-quality curved crystals provide simultaneous high spatial and spectral resolution without the need for a space-resolving slit. In particular, this combination of spatial and spectral information greatly enhances the diagnostic potential of the recorded spectra, especially when compared with the traditional analysis of a single spectrum. This provides important additional possibilities, allowing, for instance, reconstruction of the time evolution and spatial distribution of suprathermal electrons even from time-integrated spectra. This is of great practical importance, as time-dependent measurements of high-quality spectra are very difficult to implement in a highly radiative plasma environment. In addition, the existence of crossover in schemes with focusing crystals offers a very effective method for screening the instruments against penetrating particles and electromagnetic noise by creating a very small entrance window in a protective shielding located at the focal point.
Finally, we have discussed the applications of advanced X-ray spectroscopic methods (such as spherical crystal and vertical geometry Johann spectrometers) capable of providing benchmark data for advanced plasma simulations (PIC or large-scale hydrodynamic modelling of nonlinear laser–plasma interaction) and dense-plasma atomic physics. Selected topics concerning suprathermal electrons, colliding plasmas, spectral line and group broadening and shifts, ionization potential depression, and radiation fields have been reviewed in greater detail. Rather exotic phenomena such as X-ray emission of hollow ions and hollow crystals are becoming of greater interest owing to their favorable properties in suppressing opacity effects. They have been observed in dense optical laser-produced plasmas as well as in XFEL experiments. Hollow ion X-ray emission has significant potential for the characterization of complex phenomena such as hot-electron generation and propagation in dense matter and diagnostics of radiation fields. The recently initiated atomic physics modeling of hollow ions and their X-ray emission properties is to be further developed to provide a consistent interpretation of hitherto collected experimental data. In this context, future XFEL experiments could provide invaluable supplementary results, since the radiation field is a fully controlled parameter.
References
[1] R. H. Huddelstone, R. W. P. McWhirter, S. L. Leonard. Spectral intensities. Plasma Diagnostic Techniques(1965).
[2] H. R. Griem. Plasma Spectroscopy(1964).
[3] H. R. Griem. Spectral Line Broadening by Plasmas(1974).
[4] H. R. Griem. Principles of Plasma Spectroscopy(1997).
[6] V. A. Boiko, A. Ya. Faenov, S. A. Pikuz, A. V. Vinogradov, I. Yu Skobelev. X-ray spectroscopy of laser produced plasma. J. Sov. Laser Res., 6, 82(1985).
[7] T. Fujimoto. Plasma Spectroscopy(2004).
[8] H.-J. Kunze. Introduction to Plasma Spectroscopy(2009).
[19] F. B. Rosmej, Y. Zou, R. Hutton. X-ray emission spectroscopy and diagnostics of non-equilibrium fusion and laser produced plasmas. Highly Charged Ion Spectroscopic Research(2012).
[60] E. F. Eikenberry, S. M. Gruner, M. G. Rossmann, M. W. Tate, E. Arnold. Comparison of x-ray detectors. International Tables for Crystallography Volume F: Crystallography of Biological Macromolecules. International Tables for Crystallography(2006).
[114] A. Colaitis, O. Renner, F. B. Rosmej, T. Schlegel, M. Šmíd, V. T. Tikhonchuk. Characterization of suprathermal electrons inside a laser accelerated near solid density matter via highly-resolved Kα emission. Nat. Commun..
[118] M. Farjado, R. W. Lee, D. Riley, F. B. Rosmej, J. Wark et al. K-shell x-ray spectroscopy of FEL irradiated solids, beam time proposal at FLASH(2008).
[119] M. Mohan, F. Petitdemange, F. B. Rosmej. Dielectronic satellites and auger electron heating: Irradiation of solids by intense XUV-free electron laser radiation. New Trends in Atomic and Molecular Physics: Advanced Technological Applications, 91-114(2013).
O. Renner, F. B. Rosmej. Challenges of x-ray spectroscopy in investigations of matter under extreme conditions[J]. Matter and Radiation at Extremes, 2019, 4(2): 24201