• Acta Optica Sinica
  • Vol. 41, Issue 13, 1306015 (2021)
Jiahao Guo1、*, Quanbin Huang1, Siping Lian1, Dezhi Liang1、**, Yongqin Yu1、***, Chenlin Du1, and Shuangchen Ruan1
Author Affiliations
  • 1[in Chinese]
  • 13Sino-German College of Intelligent Manufacturing, Shenzhen Technology University, Shenzhen, Guangdong 518060, China
  • show less
    DOI: 10.3788/AOS202141.1306015 Cite this Article Set citation alerts
    Jiahao Guo, Quanbin Huang, Siping Lian, Dezhi Liang, Yongqin Yu, Chenlin Du, Shuangchen Ruan. Probe-Type Pressure Sensor Based on Thin-Walled Grapefruit Microstructured Fiber[J]. Acta Optica Sinica, 2021, 41(13): 1306015 Copy Citation Text show less
    Microscope image of the cross section of TW-GMF
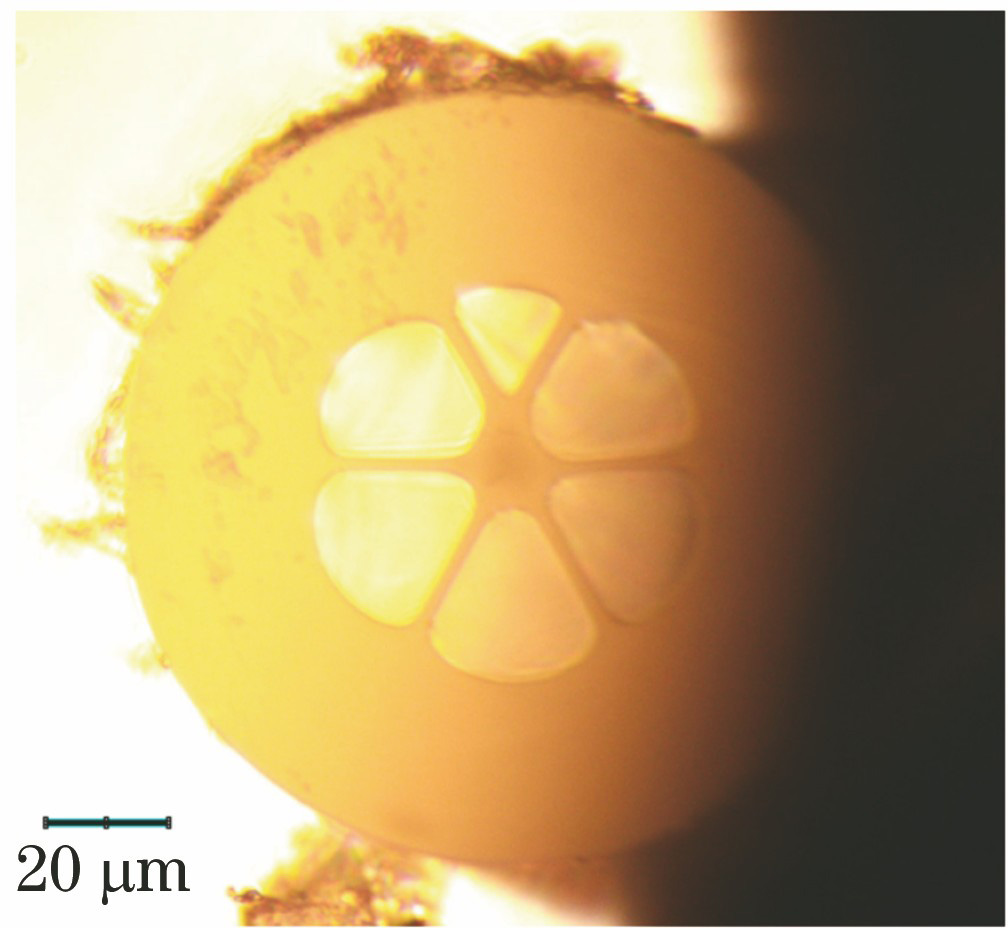
    Fig. 1. Microscope image of the cross section of TW-GMF
    Simulation modeling diagram. (a) Schematic diagram of a triangular element; (b) devision of triangular mesh in FEM
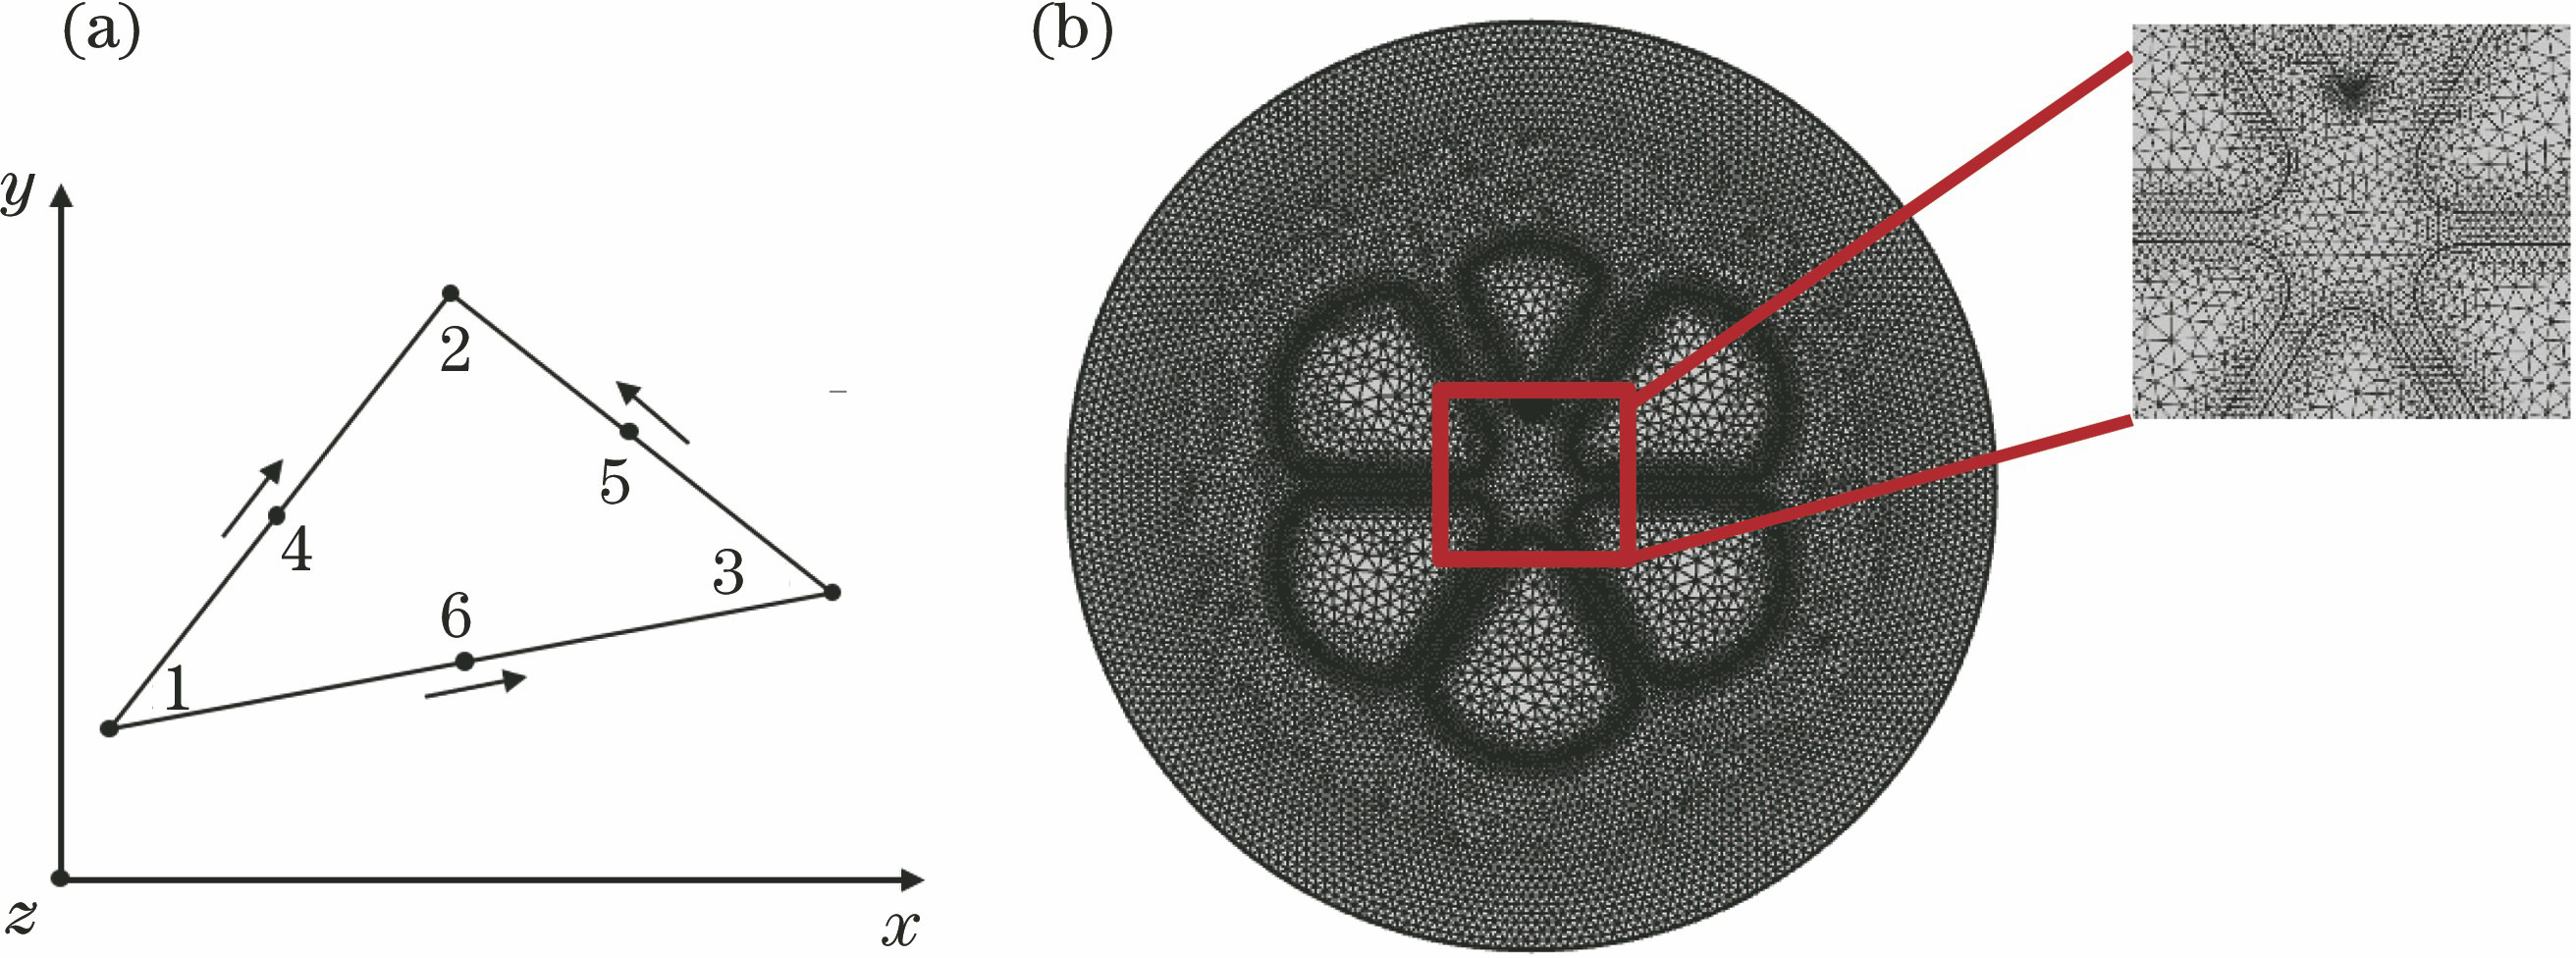
    Fig. 2. Simulation modeling diagram. (a) Schematic diagram of a triangular element; (b) devision of triangular mesh in FEM
    Mode field distributions of core mode of simulated TW-GMF at 1550 nm. (a) LP01(x), n1=1.46057; (b) LP01(y), n2=1.46055 ; (c) LP11, n3=1.45759; (d) LP11, n4=1.45754; (e) LP11, n5=1.45693; (f) LP11, n6=1.45688
    Fig. 3. Mode field distributions of core mode of simulated TW-GMF at 1550 nm. (a) LP01(x), n1=1.46057; (b) LP01(y), n2=1.46055 ; (c) LP11, n3=1.45759; (d) LP11, n4=1.45754; (e) LP11, n5=1.45693; (f) LP11, n6=1.45688
    Refractive index curves of core mode of simulated TW-GMF. Insert is the enlarged view of refractive index curves of LP01(x) and LP01(y) modes
    Fig. 4. Refractive index curves of core mode of simulated TW-GMF. Insert is the enlarged view of refractive index curves of LP01(x) and LP01(y) modes
    Variation curve of mode loss of GMF with wavelength
    Fig. 5. Variation curve of mode loss of GMF with wavelength
    Schematic diagram of reflecting modal interference structure based on refractive index guided TW-GMF
    Fig. 6. Schematic diagram of reflecting modal interference structure based on refractive index guided TW-GMF
    Image of sensor structure under microscope. Image on the right is the local magnification of fusion point
    Fig. 7. Image of sensor structure under microscope. Image on the right is the local magnification of fusion point
    Reflection spectra of GMF sensors with different lengths. (a) L=2 cm; (b) L=5 cm; (c) L=7 cm
    Fig. 8. Reflection spectra of GMF sensors with different lengths. (a) L=2 cm; (b) L=5 cm; (c) L=7 cm
    Schematic diagram of experimental setup for pressure sensing measurement
    Fig. 9. Schematic diagram of experimental setup for pressure sensing measurement
    Pressure sensing characteristics of GMF sensors with different lengths
    Fig. 10. Pressure sensing characteristics of GMF sensors with different lengths
    Response stability of GMF sensor wavelength to pressure when switching between different pressures
    Fig. 11. Response stability of GMF sensor wavelength to pressure when switching between different pressures
    Jiahao Guo, Quanbin Huang, Siping Lian, Dezhi Liang, Yongqin Yu, Chenlin Du, Shuangchen Ruan. Probe-Type Pressure Sensor Based on Thin-Walled Grapefruit Microstructured Fiber[J]. Acta Optica Sinica, 2021, 41(13): 1306015
    Download Citation