
Zhaohui Wu, Yanlei Zuo, Xiaoming Zeng, Zhaoli Li, Zhimeng Zhang, Xiaodong Wang, Bilong Hu, Xiao Wang, Jie Mu, Jingqin Su, Qihua Zhu, Yaping Dai. Laser compression via fast-extending plasma gratings[J]. Matter and Radiation at Extremes, 2022, 7(6): 064402
- Matter and Radiation at Extremes
- Vol. 7, Issue 6, 064402 (2022)
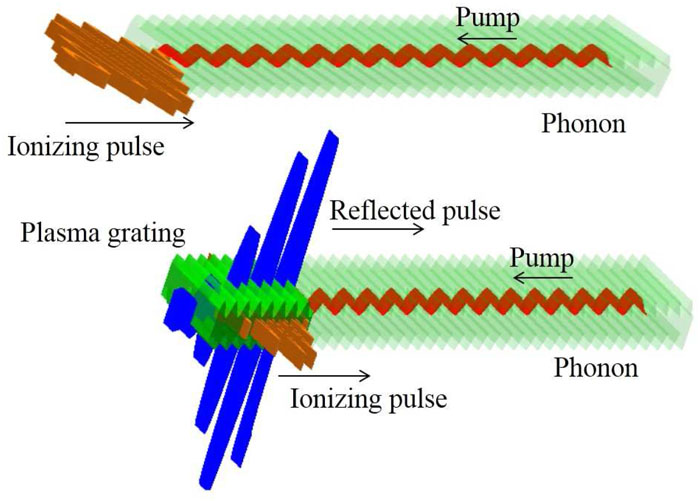
Fig. 1. Illustration of laser compression by a fast-extending plasma grating (FEPG) produced with a short ionizing pulse (brown pulse, cross-polarized) and a phonon (transparent green fringes) in a background gas. As the boundary of the plasma grating (green fringes) moves with the ionizing pulse, the reflected pulse (blue pulse) of the pump (red pulse) is compressed.
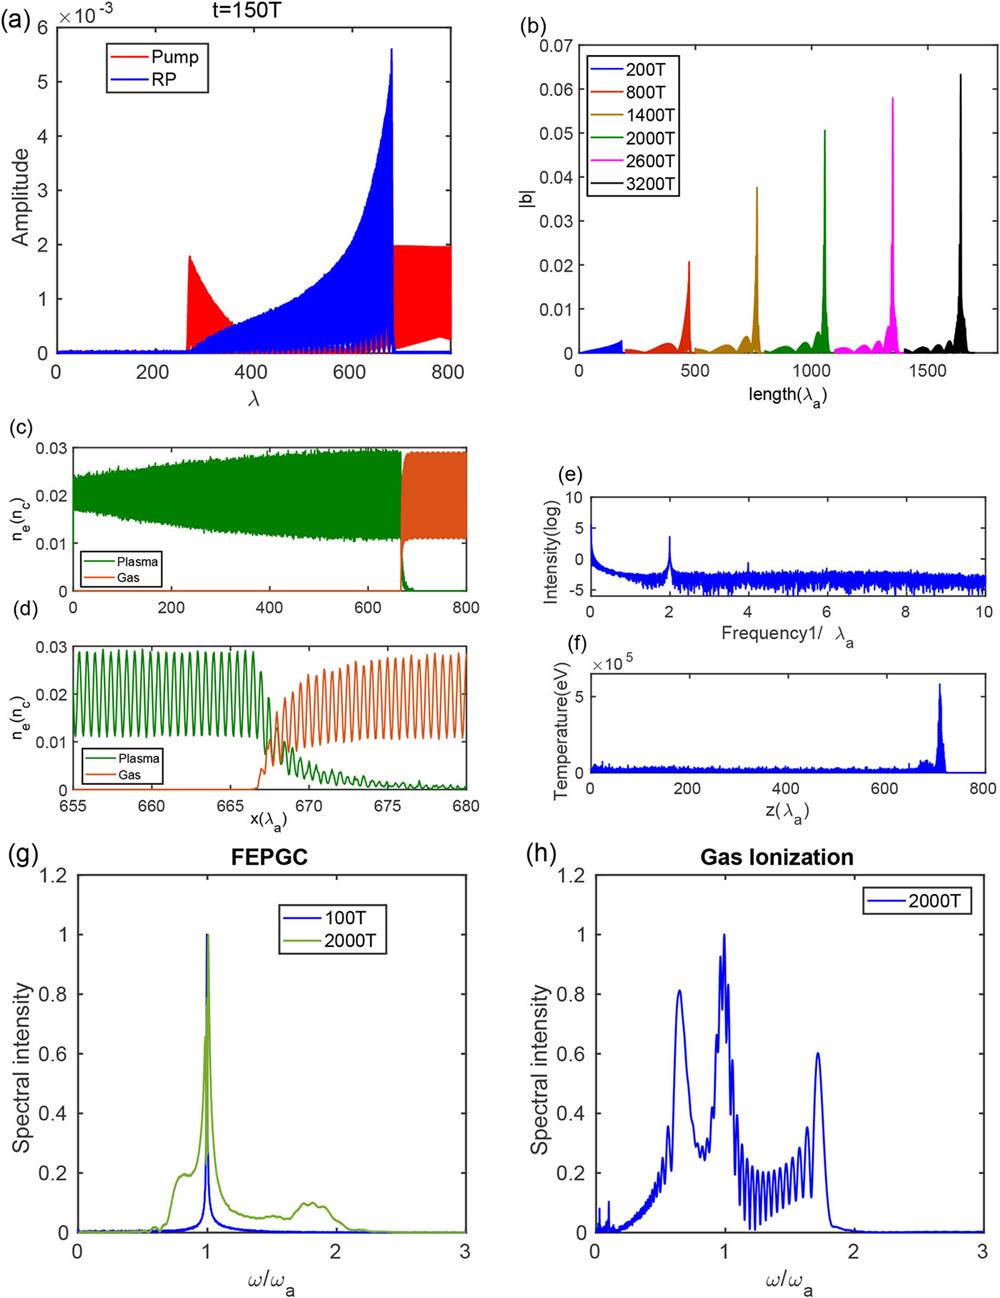
Fig. 2. One-dimensional PIC simulation results for pulse compression by FEPG at ρ 0 = 0.01n c , ρ /ρ 0 = 0.5, a 0 = 0.002, Λ = 0.502 35λ a , and λ a = 1 µ m, corresponding to T = 3.3 fs. (a) Pump (red) and RP (blue) at t = 150T . (b) Evolution of RP profiles at different interaction times. (c) Overall and (d) specific distributions of plasma grating and background gas at t = 2000T . (e) Logarithmic spatial frequency intensity of electron density. (f) Electron temperature at t = 2000T . (g) Normalized spectra of RP at t = 100T and 2000T . (h) Normalized spectrum of 10T 1 µ m laser pulse at t = 2000T used to ionize a uniform background gas of density 0.02n c .
Fig. 3. One-dimensional simulation results for (a) amplitude magnification and (b) compression ratio from FEPGC with various pump amplitudes. (c) Two-dimensional simulation result with ρ 0 = 0.01n c and a 0 = 0.006.
Fig. 4. One-dimensional PIC simulation result for FEPGC for various ρ and ρ 0. (a) Profile of pump intensity at t = 2000T with ρ /ρ 0 = 0.5, ρ 0 = 0.01n c , and a 0 = 0.006. (b) Pump penetration depth for various ρ /ρ 0 and ρ 0. (c) AM for different ρ with ρ 0 = 0.01n c , a 0 = 0.006, and Λ = 0.502 35λ a . (d) AM for different gas densities ρ 0 with ρ /ρ 0 = 0.5, a 0 = 0.006, and Λ adjusted according to the maximum AM.
Fig. 5. One-dimensional PIC simulation results for inhomogeneous plasmas. (a) Density profiles and (b) spatial frequency intensities of plasma gratings with random or periodic density fluctuations. (c) AM and (d) RP spectra for inhomogeneous plasmas.
Fig. 6. One-dimensional numerical simulation and analytical calculation of the phonon generated by two 3 ns counterpropagating laser pulses in 1 atm 20 °C hydrogen. (a) Simulation results for the laser intensity distribution after 3 ns. (b) Simulation results for ρ /ρ 0 at different times. (c) Evolution of ρ /ρ 0 obtained from the analytical solution.
|
Table 1. Steady-state values of ρ/ρ0 for several gases. Both laser pulses have wavelength 1 µm, the gas pressure P = 1 atm, and the temperature T = 20 °C. The laser intensity I is expressed in units of 1012 W/cm2.


Set citation alerts for the article
Please enter your email address

© Copyright 2018-2021 | Chinese Laser Press. All Rights Reserved 沪ICP备15018463号-20