• Journal of Geographical Sciences
  • Vol. 30, Issue 1, 119 (2020)
Zhixin HAO1、1、1、1, Maowei WU1、1, Yang LIU1、1、1、1, Xuezhen ZHANG1、1、1、1, and Jingyun ZHENG1、1、1、1、1、1、*
Author Affiliations
  • 11Key Laboratory of Land Surface Pattern and Simulation, Institute of Geographic Sciences and Natural Resources Research, CAS, Beijing 100101, China
  • 12University of Chinese Academy of Sciences, Beijing 100049, China
  • show less
    DOI: 10.1007/s11442-020-1718-7 Cite this Article
    Zhixin HAO, Maowei WU, Yang LIU, Xuezhen ZHANG, Jingyun ZHENG. Multi-scale temperature variations and their regional differences in China during the Medieval Climate Anomaly[J]. Journal of Geographical Sciences, 2020, 30(1): 119 Copy Citation Text show less
    Temperature reconstructions for China (a) and different regions of China (b-f)
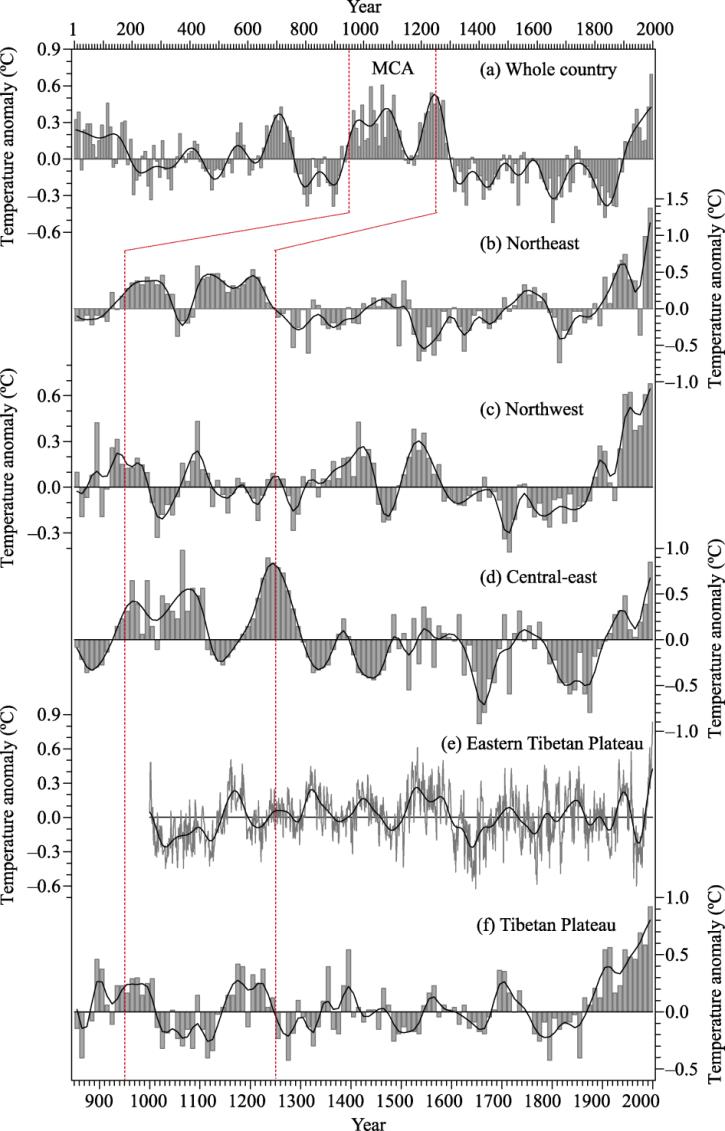
    Fig. 1. Temperature reconstructions for China (a) and different regions of China (b-f)
    EEMD analysis of reconstructed temperature series for different regions in China
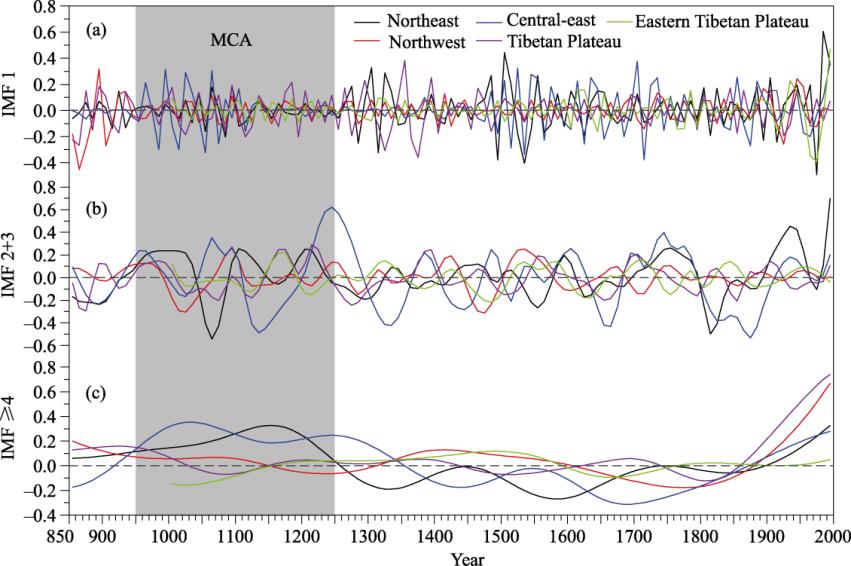
    Fig. 2. EEMD analysis of reconstructed temperature series for different regions in China
    RegionProxySpatial coverageIndicatorReconstructed periodTime resolutionReference
    Northeast ChinaIntegrated from 5 series including δ18O in peat, long-chain alkenone, stalagmite microlayer thickness, and warm/cold records.About 110 º-130 ºE, 36 º-50 ºNAnnual mean temperatureAD 1-200010 yrGe et al., 2013a
    Northwest ChinaIntegrated from 2 series of juniper tree ring width from the northern slope of Qilian Mountain.About 80 º-110ºE, 38ºN to the north borderAnnual mean temperatureAD 850-200010 yrGe et al., 2013a
    Central-east ChinaIntegrated from 11 series of historical warm/cold records, 3 of which started from 1380 and 8 of which started from 1470.About 105º-122 ºE, 24 º-36 ºNAnnual mean temperatureAD 1-200010 yrGe et al., 2013a
    Tibetan PlateauIntegrated from 8 series including δ18O in ice cores, juniper tree ring width, total organic carbon, and long-chain alkenone.About 80 º-102 ºE, 25º-38 ºNAnnual mean temperatureAD 1-200010 yrGe et al., 2013a
    Eastern Tibetan PlateauIntegrated from 12 chronologies from tree ring width.87 º-102ºE, 27 º-38ºN, 3100-4500 mMean temperature from June to AugustAD 1000-20051 yrWang et al., 2015
    Table 1.

    Information for published temperature reconstruction series by historical documents and natural evidence

    IMFNortheast ChinaNorthwest ChinaCentral-east ChinaTibetan PlateauEastern Tibetan Plateau
    IMF 129.5%24.5%11.3%31.5%42.7%
    IMF 2+329.1%28.6%40.7%25.9%38.0%
    IMF ≥421.9%46.7%29.7%34.3%18.7%
    Table 2.

    Explained variance by IMFs combination for regional reconstructions

    Zhixin HAO, Maowei WU, Yang LIU, Xuezhen ZHANG, Jingyun ZHENG. Multi-scale temperature variations and their regional differences in China during the Medieval Climate Anomaly[J]. Journal of Geographical Sciences, 2020, 30(1): 119
    Download Citation