
Zhixin HAO, Maowei WU, Yang LIU, Xuezhen ZHANG, Jingyun ZHENG. Multi-scale temperature variations and their regional differences in China during the Medieval Climate Anomaly[J]. Journal of Geographical Sciences, 2020, 30(1): 119
- Journal of Geographical Sciences
- Vol. 30, Issue 1, 119 (2020)
Abstract
1 Introduction
The impact of climate change and adaptation has become a hot spot under the background of global warming (
The climate in China has various types and large variability, which might significantly impact social and economic development. China is an ideal region to study past climate change and its impact because it has plenty of consecutive historical records and natural proxies such as tree rings, stalagmites, ice cores, and lake sediments. Historical climate change in China has always been a hot spot for Chinese and international researchers (
2 Data and methods
2.1 Data
The data used in this study include five published temperature reconstruction series derived from historical documents and natural evidence, covering most of the MCA over four regions in China (Northeast, Northwest, Central-east, and Tibetan Plateau).
| Region | Proxy | Spatial | Indicator | Reconstructed period | Time resolution | Reference |
|---|---|---|---|---|---|---|
| Northeast China | Integrated from 5 series including δ18O in peat, long-chain alkenone, stalagmite microlayer thickness, and warm/cold records. | About 110 º-130 ºE, 36 º-50 ºN | Annual mean temperature | AD 1-2000 | 10 yr | Ge |
| Northwest China | Integrated from 2 series of juniper tree ring width from the northern slope of Qilian Mountain. | About 80 º-110ºE, 38ºN to the north border | Annual mean temperature | AD 850-2000 | 10 yr | Ge |
| Central-east China | Integrated from 11 series of historical warm/cold records, 3 of which started from 1380 and 8 of which started from 1470. | About 105º-122 ºE, 24 º-36 ºN | Annual mean temperature | AD 1-2000 | 10 yr | Ge |
| Tibetan Plateau | Integrated from 8 series including δ18O in ice cores, juniper tree ring width, total organic carbon, and long-chain alkenone. | About 80 º-102 ºE, 25º-38 ºN | Annual mean temperature | AD 1-2000 | 10 yr | Ge |
| Eastern Tibetan Plateau | Integrated from 12 chronologies from tree ring width. | 87 º-102ºE, 27 º-38ºN, 3100-4500 m | Mean temperature from June to August | AD 1000-2005 | 1 yr | Wang |
Table 1.
Information for published temperature reconstruction series by historical documents and natural evidence
2.2 Method
Ensemble empirical mode decomposition (EEMD) is used in this study to extract temperature variations on different time scales and to further analyze the phase differences for decadal, multi-decadal, and centennial variations of temperature among the four regions. This method is an optimized plan originated from the empirical mode decomposition (EMD) method induced by Huang et al. (1998) and is able to overcome the edge effect and scale mixing problem by calculating the mean of an ensemble of trials that consists of the original signal and white noises of a finite amplitude (
3 Results and discussion
3.1 Temperature variation in each region during the MCA and key evidence
![]()
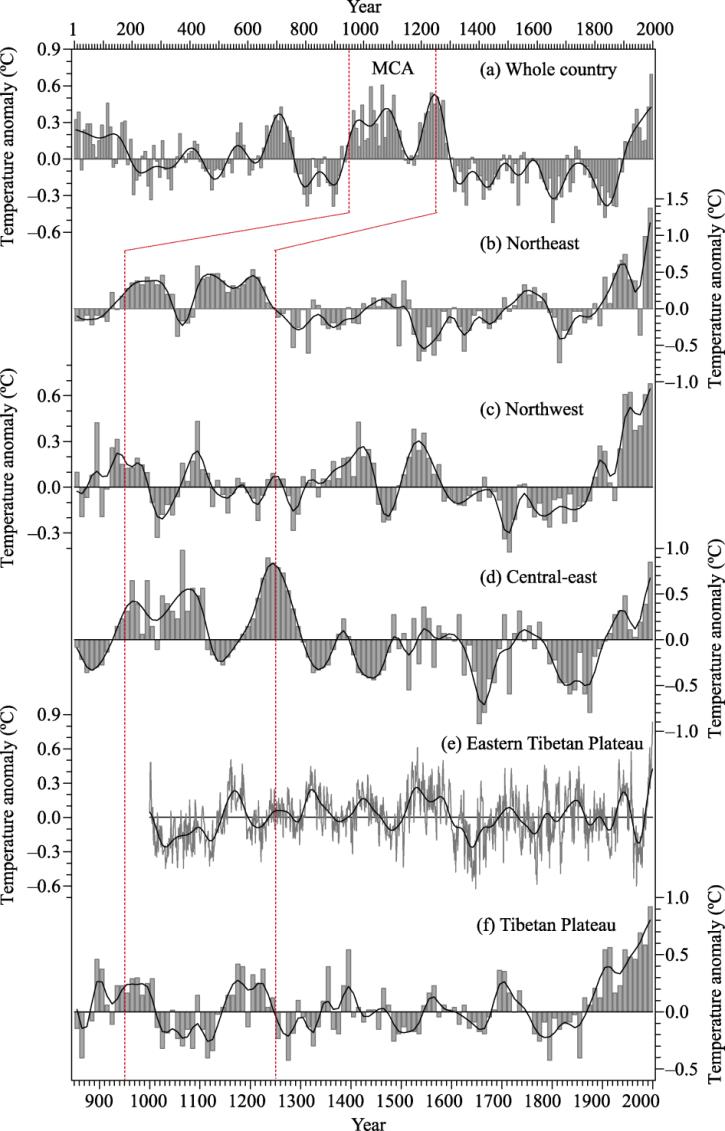
Figure 1.
(1) Northeast China
A warm climate in Northeast China existed between 920 and 1250 (
Su Song visited the Liao Dynasty during the winter of 1066 to pick up the Liao envoy and returned to Song in January 1067 (lunar calendar). He then escorted the Liao envoy back, departing from Capital Bianliang (now Kaifeng in Henan Province) on the fifth day of the tenth month in 1068 (Solar calendar is 11/2/1068, the lunar calendar is translated into solar calendar below), and was back in Bianliang in January 1069. The first Ambassador-to-Liao Poetry, which included 30 poems, was written based on the knowledge in those journeys which mostly occurred in winter (
(2) Northwest China
However, temperature reconstructions based on recorded planting boundaries, cropping systems, plant, and abnormal hydro-meteorological phenology showed that temperature in the eastern part of Northwest China around 960 was basically the same as that during 1951-1980. A warming trend continued from the 960s to 1010s, leading to the warm climate in the 1040s-1110s, which was at least 0.5°C warmer than the climate in 1951-1980. After the 1110s, the climate in this area turned cold, and the temperature during the 1120s-1180s was 0.5°C-1.0°C lower than that from 1951 to 1980. The coldest period occurred around the 1170s, with a temperature 1.0°C lower than that in 1951-1980. However, the climate became warm again in the late 12th century and lasted until at least the mid-late 13th century. The warmest stage in the MCA was the 1210s-1250s, which was about 1.0°C warmer than the period of 1951-1980. It rapidly became cold after the 1260s and entered a cold stage in the late 13th century (
(3) Central-east China
The period of 1110-1190 was a cold stage in Central-east China and was 0.1°C cooler than the REF. The coldest valley occurred around 1130-1160, with a 0.2°C cooling. It can be seen from the historical records that there was a significant increase in the number of extreme cold events, such as heavy snow and freezing hazards, and subtropical fruit trees suffered from cold injuries. For example, it was recorded that in the year of 1110 the winter in Lake Taihu basin was so cold that the citrus in Dongting mountain was killed by frost, and the same disaster hurt lychee trees in Fujian Province (
The second warm sub-period for Central-east China during the MCA was in 1190-1300, during which the region was 0.5°C warmer than in the REF, and the period of 1230-1260 was the warmest 30 years, with a 0.8°C warmer temperature compared to REF. There was a remarkable northward shift for the north boundaries of subtropics and warm temperate zones, and the movement could be at least 1°N, as indicated by historical documents (
(4) Tibetan Plateau
Many studies, especially reconstructions based on δ18O in ice cores, suggest that temperature in the Tibetan Plateau for the past 2000 years showed decadal to multi-decadal fluctuation in the first 1800 years and then increased rapidly in the recent 200 years (
3.2 The phase differences of temperature variation between different regions in China during the MCA
The second and third intrinsic mode functions (IMF 2 and 3) mainly indicate the characteristics of quasi-centennial variation on temperature in different regions. The increase in temperature in the early 10th century can be found in each region. Moreover, there are two cold sub-periods under the relatively warm background during the MCA for each region. As for the phase difference between the regions, it can be found that the centennial variation for Northwest China is basically the same as that for Central-east China during the MCA. Compared with Northwest and Central-east regions, the beginning of two cold sub-periods for Northeast China is postponed by about 30-40 years, and the end of the warm climate advanced by 40-50 years. For the Tibetan Plateau, the transition into the first cold sub-period is in synchronous with that of Northwest China and Central-east China; these transitions all occurred in the early 11th century. However, the cold sub-period in the Tibetan Plateau lasts longer than in other regions, and the region does not become warm until the mid-12th century. This leads to a large phase difference in centennial variation from the mid-11th to 13th century between Tibetan Plateau and other regions. The end of the warm climate for the Tibetan Plateau, however, is consistent with that for Northeast China, which is 40 to 50 years earlier than that for the Northwest China and Central-east China.
![]()
Figure 2.
The sum of the fourth and subsequent intrinsic mode functions (IMF≥4) and the residual indicates the temperature variation on the millennial scale for each region. It is noteworthy that a difference could be found between the MCA and LIA for Northeast China and Central-east China, yet there is no difference for Northwest China and the Tibetan Plateau. In general, the warmth in the MCA is comparable to that in the 20th century for Central-east China, is slightly weaker than in the 20th century for Northeast China and is significantly weaker than in the 20th century for Northwest China and the Tibetan Plateau. These results are consistent with previous studies, which suggested that there exists a prominent warm MCA for Eastern China but no significant warm period during 1000-1300 for Western China (
| IMF | Northeast China | Northwest China | Central-east China | Tibetan Plateau | Eastern Tibetan Plateau |
|---|---|---|---|---|---|
| IMF 1 | 29.5% | 24.5% | 11.3% | 31.5% | 42.7% |
| IMF 2+3 | 29.1% | 28.6% | 40.7% | 25.9% | 38.0% |
| IMF ≥4 | 21.9% | 46.7% | 29.7% | 34.3% | 18.7% |
Table 2.
Explained variance by IMFs combination for regional reconstructions
However, it should be noted that the possible causes for the aforementioned differences might be not only the regional difference in temperature variation but also the different sensitivities of various proxy records in response to temperature variation with different time scales.
4 Conclusion
This study investigates five regional temperature series for four regions of China (i.e., Northeast, Northwest, Central-east, and Tibetan Plateau) synthesized from recently published multi-proxy data in different locations along with temperature records from Chinese historical documents, and analyzes the decadal to centennial variations of temperature for China during the MCA and its regional differences. The EEMD method is used to analyze the phase differences between decadal, multi-decadal, and centennial variations of temperature among the regions.
The results show that the 10th-13th centuries are the longest warm period over the past 2000 years on the centennial scale over China. The mean temperature of 950-1250 was about 0.3°C higher than that of 900-1900 and 0.5°C higher than that of 1450-1850 (i.e., LIA). This warm period lasted until around 1300. The two warmest centuries occurred in 1020-1120 and 1190-1290 and were slightly warmer than the 20th century. The two warmest 30 years were 1080-1110 and 1230-1260, and the temperatures were comparable to those in 1970-2000, i.e., the warmest 30 years of the 20th century.
However, there was regional disparity in the beginning and ending decades of the MCA and in the amplitudes and phases of temperature variations on decadal to centennial scales. On the inter-decadal scale, regional temperature variations were similar during 950-1130, but amplitudes became smaller and phases became inconsistent during 1130-1250. On the quasi-centennial scale, all four regions warmed in the early 10th century and experienced two cold intervals during the MCA. However, despite the synchronized centennial variation of temperature in Northwest and Central-east China, there were significant phase differences between Northeast China and the Tibetan Plateau, and the warm climate in these two regions ended about 40-50 years earlier than in the other two regions. On the multi-centennial scale, noteworthy differences could be found between the MCA and LIA for Northeast and Central-east China, yet there was little difference for Northwest China and the Tibetan Plateau. In general, the warmth in the MCA was comparable to that in the 20th century for Central-east China, slightly weaker for Northeast China, and significantly weaker for Northwest China and the Tibetan Plateau. Possible causes for these differences might be not only the regional disparity in temperature variations but also the different sensitivity of various proxy records in response to temperature variation with different time scales.
References
[1] Y Ayenu-Prah A, O Attoh-Okine N. Comparative study of Hilbert-Huang transform, Fourier transform and wavelet transform in pavement profile analysis. Vehicle System Dynamics, 47, 437-456(2009).
[2] S Bradley R. High Resolution Records of Past Climate from Monsoon Asia: The Last 2000 years and Beyond: Recommendations for Research. Bern, Switzerland: IGBP PAGES Workshop Report Series 93-1.(1993).
[3] S Bradley R. Past global changes and their significance for the future. Quaternary Science Reviews, 19, 391-402(2000).
[4] S Bradley R, K Hughes M, F Diaz H. Climate in medieval time. Science, 302, 404-405(2003).
[5] Deliang Chen, Baiqing Xu, Tandong Yao et al. Assessment of past, present and future environmental changes on the Tibetan Plateau. China Science Bulletin, 60, 3025-3035(2015).
[6] Zibin Chen, Jingzhi Qi. Annotation of Su Song’s Ambassador-to-Liao Poetry, a friendly journey of thousands kilometers. Journal of Chengde Teachers College for Nationalities, 2, 1-38(1993).
[7] J Crowley T, S Lowery T. How warm was the medieval warm period?. AMBIO: A Journal of the Human Environment, 29, 51-54(2000).
[8] F Diaz H, R Trigo, K Hughes M et al. Spatial and temporal characteristics of climate in medieval times revisited. Bulletin of the American Meteorological Society, 92, 1487-1500(2011).
[9] Quansheng Ge. Climate Change in Chinese Dynasties(2011).
[10] Quansheng Ge, Zhixin Hao, Jingyun Zheng et al. Temperature changes over the past 2000 yr in China and comparison with the Northern Hemisphere. Climate of the Past, 9, 1153-1160(2013).
[11] Quansheng Ge, Zhong Hua, Jingyun Zheng et al. Forcing and impacts of warm periods in the past 2000 years. Chinese Science Bulletin, 60, 1727-1734(2015).
[12] Quansheng Ge, Haolong Liu, Xiang Ma et al. Characteristics of temperature change in China over the last 2000 years and spatial patterns of dryness/wetness during cold and warm periods. Advances in Atmospheric Sciences, 34, 941-951(2017).
[13] Quansheng Ge, Jian Liu, Xiuqi Fang et al. General characteristics of temperature change and centennial warm periods during the past 2000 years. Acta Geographica Sinica, 68, 579-592(2013).
[14] Quansheng Ge, Jingyun Zheng, Zhixin Hao et al. State-of-the-arts in the study of climate changes over China for the past 2000 years. Acta Geographica Sinica, 69, 1248-1258(2014).
[15] Quansheng Ge, Jingyun Zheng, Zhixin Hao et al. Recent advances on reconstruction of climate and extreme events in China for the past 2000 years. Journal of Geographical Sciences, 26, 827-854(2016).
[16] Quansheng Ge, Jingyun Zheng, Yanyu Tian et al. Coherence of climatic reconstruction from historical documents in China by different studies. International Journal of Climatology, 28, 1007-1024(2008).
[17] Hao Guo, Peng Li, Xinhe Tai. Research of Liao River. History and Geography of Northeast China, 6, 35-39(2012).
[18] Zhixin Hao, Quansheng Ge, Jingyun Zheng. Temperature variations during the Song and Yuan dynasties (960-1368 A.D.) in the eastern part of Northwest China. Quaternary Sciences, 29, 871-879(2009).
[19] E Huang N, Zheng Shen, R Long S et al. The empirical mode decomposition and the Hilbert spectrum for nonlinear and non-stationary time series analysis. Proceedings of the Royal Society of London A: Mathematical, Physical and Engineering Sciences, 454, 903-995(1998).
[20] E Huang N, Zhaohua Wu. A review on Hilbert-Huang transform: Method and its applications to geophysical studies. Reviews of Geophysics, 46(2008).
[21] K Hughes M, F Diaz H. Was there a ‘medieval warm period’, and if so, where and when?. Climatic Change, 26, 109-142(1994).
[22] . Managing the Risks of Extreme Events and Disasters to Advance Climate Change Adaptation. A Special Report of Working Groups I and II of the Intergovernmental Panel on Climate Change(2012).
[23] . Summary for policymakers. In: Climate Change 2014: Impacts, Adaptation, and Vulnerability. Part A: Global and Sectoral Aspects. Contribution of Working Group II to the Fifth Assessment Report of the I(2014).
[24] Zhimin Man. Relationship between geographic northern bounds of orange cultivation in Chinese history and the climatic changes. Fudan Journal (Social Sciences), 5, 72-77(1999).
[25] Zhimin Man. Climate Change Research in Chinese History.(2009).
[26] Science Plan and Implementation Strategy. IGBP Report No.57. Stockholm: IGBP Secretariat.(2009).
[27] PAGES Restructured. Past Global Changes Magazine, 22, 3(2014).
[28] Dahe Qin. Climate change science and sustainable development. Progress in Geography, 33, 874-883(2014).
[29] Xuemei Shao, Yan Xu, Zhiyong Yin et al. Climatic implications of a 3585-year tree-ring width chronology from the northeastern Qinghai-Tibetan Plateau. Quaternary Science Reviews, 29, 2111-2122(2010).
[30] G Shiyatov S. The upper timberline dynamics during the last 1100 years in the Polar-Ural mountains. In: Oscillations of the Alpine and Polar Tree Limits in the Holocene(1993).
[31] G Shiyatov S, S Mazepa V. Contemporary Expansion of Siberian Larch into the Mountain Tundra of the Polar Urals. Russian Journal of Ecology, 46, 495-502(2015).
[32] W Steffen. Preface of Chinese Edition. In: Global Change and the Earth System: A Planet Under Pressure. Chen Panqin, Lin Hai, Ge Quansheng et al. trans(2003).
[33] G Thompson L, E Mosley-Thompson, H Brecher et al. Abrupt tropical climate change: Past and present. Proceedings of the National Academy of Sciences, 103, 10536-10543(2006).
[34] Minwei Wan. Selected Natural Calendars of China.(1986).
[35] Bing Wang, Xiaodong Li. Multi-scale fluctuation of European temperature revealed by EEMD Analysis. Acta Scientiarum Naturalium Universitatis Pekinensis, 47, 627-635(2011).
[36] Jianglin Wang, Bao Yang, C Ljungqvist F. A millennial summer temperature reconstruction for the eastern Tibetan Plateau from tree-ring width. Journal of Climate, 28, 5289-5304(2015).
[37] Shaowu Wang, Xinyu Wen, Yong Luo et al. Reconstruction of temperature series of China for the last 1000 years. Chinese Science Bulletin, 52, 958-964(2007).
[38] Meng Wei, Fangli Qiao. Attribution analysis for the failure of CMIP5 climate models to simulate the recent global warming hiatus. Science China Earth Sciences, 46, 1675-1688(2016).
[39] Zhaohua Wu, E Huang N, R Long S et al. On the trend, detrending, and variability of nonlinear and nonstationary time series. Proceedings of the National Academy of Sciences, 104, 14889-14894(2007).
[40] Bao Yang, Chun Qin, Jianglin Wang et al. A 3,500-year tree-ring record of annual precipitation on the northeastern Tibetan Plateau. Proceedings of the National Academy of Sciences, 111, 2903-2908(2014).
[41] De’er Zhang. A study on the medieval warm period in China. Quaternary Sciences, 13, 7-15(1993).
[42] Ke Zhao. Research for the time that Su Song picked up Liao envoy and his first visit to Liao, a correction for chronology of Su Song. The Northern Forum, 4, 58-59(1992).
[43] Jingyun Zheng, Lingling Ding, Zhixin Hao et al. Extreme cold winter events in southern China during AD 1650-2000. Boreas, 41, 1-12(2012).


Set citation alerts for the article
Please enter your email address

© Copyright 2018-2021 | Chinese Laser Press. All Rights Reserved 沪ICP备15018463号-20