Zhimin Jing, Peihang Li, Cuiping Ma, Jiaying Wang, Roberto Caputo, Alexander O. Govorov, Arup Neogi, Hongxing Xu, Zhiming Wang, "Active spatial control of photothermal heating and thermo-actuated convective flow by engineering a plasmonic metasurface with heterodimer lattices," Photonics Res. 10, 2642 (2022)
Copy Citation Text
Thermo-plasmonics, using plasmonic structures as heat sources, has been widely used in biomedical and microfluidic applications. However, a metasurface with single-element unit cells, considered as the sole heat source in a unit cell, functions at a fixed wavelength and has limited control over the thermo-plasmonically induced hydrodynamic effects. Plasmonic metasurfaces with metal disk heterodimer lattices can be viewed to possess two heat sources within a unit cell and are therefore designed to photo-actively control thermal distributions and fluid dynamics at the nanoscale. The locations of heat sources can be switched, and the direction of the convective flow in the central region of the unit cell can be reversed by shifting the wavelength of the excitation source without any change in the excitation direction or physical actuation of the structural elements. The temperature and velocity of a fluid are spatiotemporally controlled by the wavelength selectivity and polarization sensitivity of the plasmonic metasurface. Additionally, we investigate the effects of geometric parameters on the surface lattice resonances and their impact on the temperature and fluid velocity of the optofluidic system. Our results demonstrate excellent optical control of these plasmonic metasurface heating and thermal convection performances to design flexible platforms for microfluidics.
1. INTRODUCTION
Thermo-plasmonics opens up new opportunities for areas such as photothermal therapy [1,2], drug delivery [3], biosensing [4], solar-light harvesting [5], superhydrophobic coatings [6,7], trapping and rotating nanoparticles [8,9], high-resolution spectroscopies of nanoscale chirality [10,11], and manufacturing [12]. The photothermal effects in plasmonic structures generate micro- or nanoscale nonuniformity in thermal distribution, inducing hydrodynamic effects such as natural convection [13,14], Marangoni flow [15], thermophoresis [16], thermo-osmosis [17], thermoelectric pulling [18], and depletion forces [19]. However, controlling the photothermal energy distribution and fluid motion in systems based on plasmonic metasurface or photoactive material is challenging. Various means have been adopted to tackle this issue, such as modifying the spectral response from the surface plasmon resonance (SPR) band of plasmonic metasurfaces. For example, modifying the geometrical configuration (interparticle coupling) can change the near-field interaction of spatially localized electric fields, giving rise to an obvious shift of the SPR [20–23]. However, this scheme usually needs controllable manipulation at nanoscale dimensions, which is passive and challenging to implement. In addition, the spectral response of plasmonic metasurfaces embedded within a photoactive or nonlinear medium such as liquid crystals, phase-change materials, and layered two-dimensional or III–V semiconductors can be modified by a change in their dielectric properties [24–27]. Nevertheless, an external stimulus such as an electrical, magnetic, or electrochemical effect is necessary to induce a reversible change in the refractive index of the medium—a process that can be slow and inefficient compared to an optically induced effect.
Thermo-optical and light–matter interactions can be actively manipulated by modifying the localized SPR through an appropriate choice of the intrinsic property of the excitation source, such as polarization state, angle of incidence, phase, beam shape, or wavelength of the laser. The polarization state of incident light has been shown to modify the dielectrophoretic forces to manipulate biological cells [28]. The phase of incident coherent radiation was used to modulate electromagnetic force distribution and generate potential traps to manipulate nanoparticles [29]. A radially polarized beam can enhance the excitation of SPR and trapping efficiency [30]. However, the excitation of metal nanoparticles with characteristic localized SPR (LSPR) is restricted by the fixed resonant wavelength of the excitation source. The light absorption efficiency and, consequently, the localized heating are significantly lowered when the excitation source is detuned from this resonant LSP energy or directed away from the nanoparticles.
The range of SPR interactions has been enlarged by exploiting surface lattice resonances (SLRs)—a collective, coupled mode between the LSPR of the single nanostructures and the diffractive behavior of the periodic lattice [31–34]. SLR structures are photonic lattices with narrow resonances that can be tuned to any desired operating wavelength and exhibit localized electric field and micrometer-scale delocalization [35,36]. The in-plane diffraction modes in a homogeneous environment or the evanescent diffraction orders termed Rayleigh anomalies (RAs) in an inhomogeneous environment result in an extended range of the excitation field of the SLR [37]. The orthogonal or parallel coupling within an SLR structure enables polarization control of incident light to manipulate the light–matter interaction within the meta-structure [38]. In this regard, our recent work proves that SLR has more advantages and application values than LSPR in optofluidics [39].
Sign up for Photonics Research TOC. Get the latest issue of Photonics Research delivered right to you!Sign up now
However, from the perspective of the morphology and lattice arrangement of metasurfaces, once the structures are designed, these SLR structures are passive because the lattice parameters of the plasmonic crystal will restrict the operational wavelength. And these structures with single-element unit cells are generally considered to be a heat source in a unit cell, operating with limited control of heat distributions and fluid dynamics. Also, the direction of the fluid flow is not easily manipulated flexibly in a symmetrical passive system. Recently, asymmetric nanostructures have been demonstrated to provide an additional degree of freedom to manipulate SLR and can be used as a sensing platform [40,41]. Asymmetric plasmonic heterostructures are also increasingly used to achieve nanoscale localized heat generation [42–44]. Another recent approach uses superlattices, composed of finite arrays of nanoparticle patches grouped into microscale arrays to extend the scope from single-mode (SM) to multimode lattice resonances [45,46]. The presence of a multimode resonance with an asymmetric nanostructures array is likely to provide both wavelength and polarization sensitivity to SLR structures in addition to the usual wave vector sensitivity to incident radiation. Motivated by the possibility of realizing an optically active SLR structure for thermo-plasmonics, the design of a plasmonic metasurface composed of metal disk heterodimer (MDH) lattices is studied.
This work presents an active thermo-plasmonic device for wavelength- and polarization-controlled optical heating and thermal convection by exploiting the SLRs of MDH arrays. Specifically, spatially modulated nanoscale control of the photoinduced heating sites and thermally induced convection can be achieved by switching the incident wavelength to the respective SLR modes. The excitation wavelength can also modulate the convective flow rate of the fluid in the radial direction and its temperature in the orthogonal direction. The design of the SLR is investigated mathematically using the plasmon-hybridization technique. A parametric study of the various factors influencing the nanoscale temperature control and fluid flow in the MDH optofluidic system is presented. The proposed method for the active spatial control of photothermal heating and its induced hydrodynamic effects has a tremendous prospect in the application of optofluidic systems.
2. MODEL AND FORMALISM OF PHOTOTHERMAL HEATING AND THERMAL CONVECTION
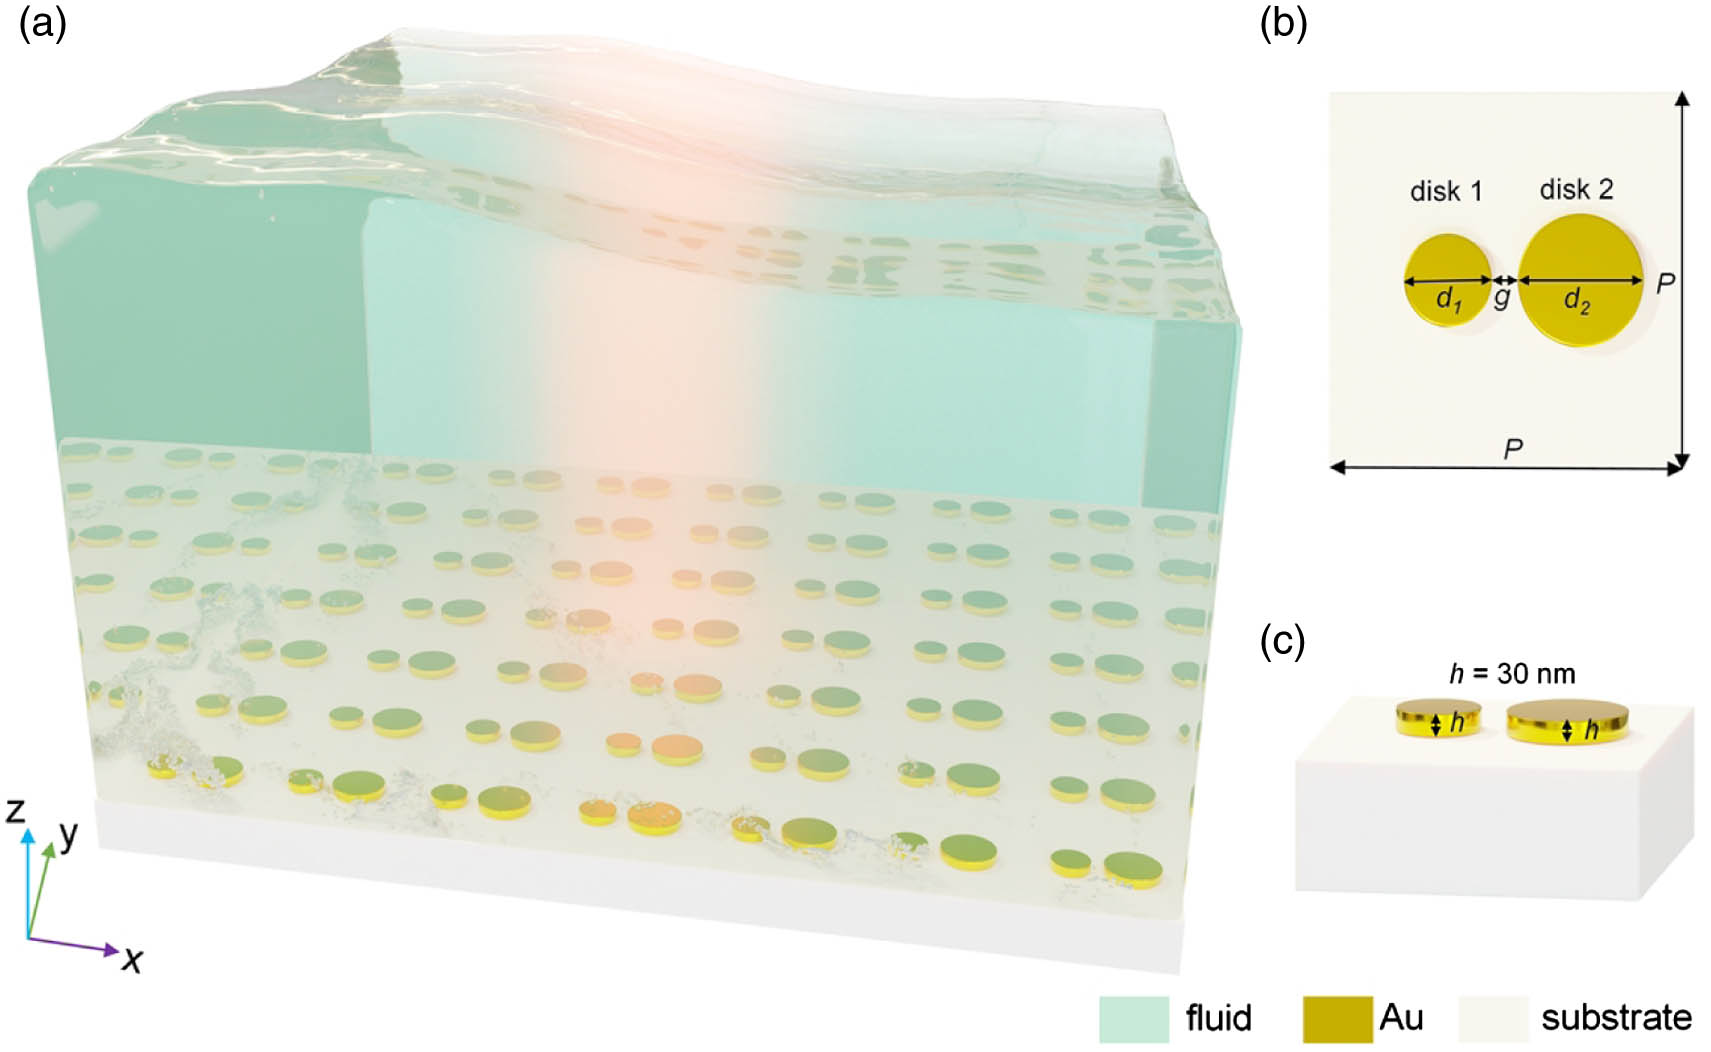
The schematic of the proposed MDH arrays is shown in Fig. 1(a). A square array of MDH immersed in an index matching solution () is fabricated onto a substrate () to obtain a homogenous environment. The unit cell of the MDH arrays is shown in Figs. 1(b) and 1(c). The period of the square array is , the diameters of the two asymmetric disks (disk 1 and disk 2) are and , respectively, and the gap between disk 1 and disk 2 is . The thickness of each disk is 30 nm. As a constituent material, Au is chosen due to its chemical stability, relatively low loss in the near-infrared band, and ease of fabrication for realizing an actual optofluidic system [47,48]. The proposed MDH arrays can be fabricated using electron beam lithography, gold deposition, and liftoff processes.
Figure 1.(a) Schematic of metal disk heterodimer (MDH) arrays consisting of a square array of MDH deposited onto a glass substrate. The environment of the MDH is index-matched with the substrate using solution (). (b), (c) Schematic of the unit cell of the periodic array with , , , , and , where is the diameter of the metal disk, 1 and 2 correspond to the two disks of MDH, is the gap between disk 1 and disk 2, is the period of the array, and is the height of the disk. The steam bubbles presented here are just to illustrate the fluid vividly; they have nothing to do with boiling the fluid.
Illuminated by a normally incident plane wave, extinction (sum of absorption and scattering) of MDH arrays is defined as 1-T, where T is the transmission through the MDH arrays. MDH arrays absorb incident light, resulting in heat dissipation, and the thermal generation is derived from the heat power density inside MDH arrays: where is the complex conjugate of the local induced current density, which generates heat losses via the Joule effect, is the electric field in the MDH arrays, is vacuum permittivity, and is the frequency-dependent relevant permittivity of the MDH arrays. Extensive studies proved that this heat generation in MDH arrays results in a temperature distribution within the MDH arrays governed by the heat transfer equation [49,50] where , , are density, specific heat capacity at constant pressure, and thermal conductivity of the metal, respectively, and is the spatial temperature distribution. Baffou et al. pointed out that although may be non-uniform depending on the shape of the nanostructure, the temperature distribution throughout the nanostructure is highly uniform due to the high thermal conductivity of the metal compared to the surrounding fluid [51]. Since light absorption outside the MDH arrays is almost negligible, the heat power density equals zero, but convection may exist. At this point, the temperature distribution in the surrounding medium is governed by [49] where , , are mass density, specific heat capacity at constant pressure, and thermal conductivity of the surrounding fluid, respectively, and is the fluid velocity in the surrounding medium.
A change in temperature of the surrounding fluid will change its density. In general, the density will decrease as the temperature increases. As a result, the fluid at other locations will flow toward the center of mass reduction in a toroidal form due to the continuity of fluid, thus causing an upward generation of convection of the fluid. This fluid velocity profile is represented by the Navier–Stokes equation [14,52] with continuity equation , where and are, respectively, the kinematic viscosity of the fluid and the volume force (here only buoyancy) per unit mass due to the temperature gradient. The initial values of velocity are . In nonisothermal flow calculation, the Boussinesq approximation is used to deal with the buoyancy force caused by the temperature difference to simplify the calculation [14]: where , , , are gravitational acceleration, dilatation coefficient of fluid, initial temperature, and upward -direction unit vector, respectively.
All calculations for the classical electromagnetic properties, temperature distributions, and fluid distributions have been carried out by commercial finite-element software (COMSOL Multiphysics v 5.5). By using modules of “electromagnetic waves, frequency domain,” “heat transfer in solids and fluids,” “laminar flow,” and Multiphysics coupled interfaces of “electromagnetic heating,” “nonisothermal coupling,” Eqs. (1)–(5) are solved to investigate the multidisciplinary problem in the MDH arrays. , , , and are set to 450 nm, 80 nm, 120 nm, and 40 nm, respectively. MDH arrays are placed on a 1 μm thick substrate and immersed in 1 μm thick fluid. The incident plane wave is impinging from the fluid side to interact with the MDH arrays, exciting SLRs. The dielectric constants of Au are taken from the experimental data given by Johnson and Christy [53]. The details of the modeling and computational settings can be found in Appendix A.
3. RESULTS AND DISCUSSION
A. Excitation and Understanding of SLR
The excitation of the SLRs initiates the light-actuated modulation of the fluid for MDH arrays. Figure 2 depicts the optical properties of plasmonic lattices. The extinction spectrum of MDH arrays for the electric field parallel to the axis shows two obvious resonances at 679 nm (mode I) and 775 nm (mode II) [Fig. 2(a) red solid curve]. A different response is obtained when the electric field is parallel to the axis, showing just one obvious resonance at 786 nm [Fig. 2(a) black dashed line]. The calculated positions of these resonances both occur near the (, 0) and (0, ) RAs at around 657 nm (blue dotted line), implying the presence of SLRs. Moreover, we can also observe the (, ) RAs at around 464 nm (blue dotted line). Here, for a square lattice and homogeneous index , these positions of RAs can be obtained by [54] where is the angle of incidence, and and are integers corresponding to the diffracted order of the RAs. In addition, the extinction spectra of homodimer 1 (consisting of two identical disks 1) arrays and homodimer 2 (consisting of two identical disks 2) arrays are given in Fig. 2(b). One can see obvious resonance (at 685 nm) of homodimer 1 arrays (orange solid curve) and the other obvious resonance (at 768 nm) of homodimer 2 arrays (cyan solid curve) from Fig. 2(b). It is not difficult to find that the resonance wavelength separation of homodimers 1 and 2 arrays () is smaller than MDH arrays (), which indicates that coupling behavior occurs in MDH. Figures 2(c)–2(f) show the electric field distributions of MDH at the two resonant wavelengths when the incident electric field is polarized. It can be seen that the electric field distributions vary with the incident wavelength. At 679 nm, the large electric field is distributed mainly around disk 1, while at 775 nm, the strong electric field is localized mostly around disk 2. The current density distributions (represented with white arrows) in the same direction on the two disks in the plane indicate that the two oscillations are in-phase at 679 nm [Fig. 2(c)]. This resonance is thereby considered to be the symmetric mode. At 775 nm, the current density distributions on the two disks are in opposite directions in the plane [Fig. 2(e)]. It implies that the two oscillations are out of phase, so the resonance can be considered the antisymmetric mode. In particular, some electric field distributions can be seen at the gap between the two disks, indicating the plasmon hybridization in MDH. Additionally, the localized field distributions on the heterodimer and delocalized field distributions along the direction in Figs. 2(c) and 2(e) reveal the coupling between LSP and (, 0) RAs, thus confirming the generation of dual SLRs. Figures 2(g) and 2(h) show the electric field distributions of MDH for the -polarized electric field at resonance. It is observed that at 786 nm, most of the electric field is distributed on the surface of disk 2. Furthermore, current density distributions (represented with white arrows) on the two disks in the same direction indicate the bonding oscillations [Fig. 2(g)]. Similarly, the localized field distributions on the heterodimer and the delocalized field distributions along the direction are observed in Figs. 2(g) and 2(h). It indicates the coupling between LSP and (, 0) RAs, thus confirming the generation of a single SLR.
Figure 2.Optical properties of plasmonic metasurface. (a) Extinction spectra of MDH arrays for - and -polarized incidence conditions. Inset: unit cell of MDH arrays. (b) Extinction spectra of homodimer 1 and homodimer 2 arrays for -polarized incidence conditions. Inset: unit cells of homodimer 1 and 2 arrays. (c)–(h) Electric field distributions of MDH at the two resonant wavelengths of and under polarization (c)–(f) and under -polarization (g), (h). (i) Schematic plasmon hybridization of MDH.
Figure 2(i) depicts the schematic plasmon hybridization of MDH with different polarizations. For -polarized excitation, the vertical dipole of disk 1 and the quadrupole of disk 2 at 679 nm (investigated in Appendix B) indicate that the symmetric mode is derived from the plasmon hybridization between the dipolar resonance of disk 1 with the quadrupolar resonance of disk 2. Furthermore, its energy is closer to the dipolar resonance of disk 1. The vertical dipoles of disk 1 and disk 2 at 775 nm (investigated in Appendix B) indicate that the antisymmetric mode derives from plasmon hybridization between the dipolar resonance of disk 2 with the dipolar resonance of disk 1, and its energy is closer to the dipolar resonance of disk 2. For -polarized excitation, the horizontal dipoles of disk 1 and disk 2 at 786 nm (investigated in Appendix B) indicate that a bonding dipole–dipole mode appears. It results from the plasmon hybridization between the dipolar resonance of disk 1 with disk 2, and its energy is lower than the respective dipolar resonance of disk 1 and disk 2. The plasmon hybridization method is used to mathematically analyze the relationship between plasmon hybridization modes and the resonance of the two disks. For the -polarized excitation case, the symmetric mode and antisymmetric mode can be expressed by [55] where and are plasmon modes of disk 1 and disk 2, and is a constant that depends on the relative energies of plasmon modes for disk 1 and disk 2 and their interaction strength. Since is closest in energy to and is closest in energy to , it is not difficult to conclude that contributes significantly more to than , and contributes significantly more to than . For the -polarized excitation case, the bonding dipole–dipole mode is given by where is a constant that depends on the relative energies of plasmon modes for disk 1 and disk 2 and their interaction strength. Note that in Eqs. (7) and (8), and in Eq. (9).
B. Controlled Photothermal Heating and Convective Flow
Computational results in Fig. 3 provide an overview of the nanoscale spatial control of photothermal heating and thermo-actuated convection flow based on SLRs. Figure 3 explores the photoinduced control of temperature and thermally induced convection distributions in MDH by illuminating it with different polarizations and wavelengths of incident light. Based on typical values found in the literature [13,56], an incident light flux of is chosen. Halas and Nordlander et al. reported that the heat transfer process occurs in a very short period (on the order of ps-ns) [57], so to observe the heat transfer process more clearly, the data are processed for . The arrows on the streamlines denote the direction of motion of the fluid. Different colors represent different magnitudes of the surface temperature and fluid velocity. For -polarized incidence [Figs. 3(a)–3(d)], Figs. 3(a) and 3(b) show the horizontal () and vertical ( and ) 2D slices of fluid convection overlaid on the temperature distributions at a wavelength of 679 nm. The magnitude of the temperature distributions shows a prominent feature; disk 1 has more pronounced photoinduced heat generation than disk 2. These inhomogeneous heat distributions at the nanoscale naturally induce asymmetric convective fluid distributions around the MDH. These effects are reversed in Figs. 3(c) and 3(d), where the horizontal () and vertical ( and ) 2D slices of fluid convection overlaid on the temperature distributions at a wavelength of 775 nm are presented. In this case, a higher photoinduced temperature distribution of disk 2 than disk 1 can be observed. Irradiation at 775 nm also generates asymmetric convective fluid distributions around the MDH. Such obvious differences in temperature and flow field distributions at different incident wavelengths prove the wavelength-dependent photoinduced temperature and thermally induced convection at the nanoscale. These simulated observations indicate the possibility of switching the location of the heat source and thereby reversing the direction of the convective flow in a small area by tuning the excitation wavelength without any beam deflection or translation of the structural elements of the asymmetric structures. For the -polarized incidence case, Figs. 3(e) and 3(f) show the horizontal () and vertical ( and ) 2D slices of fluid convection overlaid on the temperature distributions at a wavelength of 786 nm. One can observe nearly the same temperature and fluid flow distributions as in Figs. 3(c) and 3(d), but the amplitudes of temperature and velocity are smaller than in Figs. 3(c) and 3(d). The distinct differences in the temperature and flow field distributions at different incident polarizations also prove the polarization-dependent photoinduced temperature and thermally induced convection at the nanometer scale. Please note that the temperature and flow field distributions presented here are responses of a single cell, which we want to use to emphasize the response difference in more detail under different illumination cases. The differences in temperature and convection patterns between different wavelengths and polarizations (at the macroscopic scale) are also presented in Appendix E, where we approximately simulate the response of the MDH array system. These results also prove the wavelength- and polarization-dependent photoinduced temperature and thermally induced convection at the macroscopic scale within the excitation time of the order of ns.
Figure 3.Controlled photothermal heating and thermo-actuated convective flow of MDH under different incident wavelengths and polarizations at the nanoscale. (a)–(f) Photoinduced control of temperature and thermally induced convection distributions in MDH. (g) Velocity map of the fluid flow along the direction ( and ). Three different measuring points , , and are marked in green solid circle, magenta solid triangle, and turquoise solid square, respectively. All data are given at the time for the incident light flux of .
To further elucidate photo-actively controlled fluid dynamics, Fig. 3(g) depicts the velocity map of the fluid along the direction ( and ) at different wavelengths and polarizations of incident light. The direction of fluid flow is indicated by positive and negative values, and the flow rate is represented by numerical values. The velocity components of three points , , and along the direction are measured in different cases. One can observe that the velocity magnitude and direction of the three measuring points differ under different incident conditions. Interestingly, the direction of the velocity at is reversed when the incident situation is changed; the magnitude of the velocity at of 679 nm incidence under the polarization case is larger than the other two cases. However, the magnitude of the velocity at of 775 nm incidence under the polarization case is greater than in the other two cases. Therefore, it can be concluded that when the excitation wavelength or polarization state changes, a reversal of the direction of fluid flow occurs at the location between the two heat sources, and switching occurs at the location of two heat sources. Therefore the wavelength and polarization state of incident light can be used as an additional degree of freedom to switch the location of the heat source and reverse the direction of the convective flow in part of the region.
To unveil the reasons behind this active spatial controllable phenomenon, we calculate the total power dissipation (i.e., total absorbed power) of the MDH in Fig. 4(a). Two distinct peaks occur at 679 nm and 775 nm due to the absorption of two disks at dual SLRs under -polarized illumination [Fig. 4(a) red solid curve]. Only one peak occurs at 786 nm due to the absorption of two disks at single SLRs under -polarized illumination [Fig. 4(a) black dashed line], indicating the total photothermal heating in the MDH. The contribution of the respective heat generation of the two disks to the total photothermal heating is estimated from the percentage of heat generation and heat distributions as calculated in Figs. 4(b)–4(d). In the case of illumination by -polarized light, Fig. 4(b) shows that from 678 nm to 710 nm, more than 90% of the total photothermal heating of the system is contributed by disk 1; however, when the wavelength is larger than 766 nm, more than 90% of the total heat of the system is contributed by disk 2. Correspondingly, as depicted in Fig. 4(d), at 679 nm, heat is predominantly concentrated on disk 1, while at 775 nm, heat is distributed mostly on disk 2. This wavelength-dependent heat generation explains the wavelength-dependent temperature and convection distributions in Fig. 3. In the case of -polarized illumination, Fig. 4(c) shows that when the wavelength is larger than 676 nm, more than 80% of the total heat of the system is contributed by disk 2. Correspondingly, as depicted in Fig. 4(d), at 786 nm, heat is concentrated mainly on the surface of disk 2. This polarization-dependent heat generation justifies the polarization-dependent temperature and convection distributions in Fig. 3.
Figure 4.Heat generation of MDH arrays. (a) Total absorbed power of MDH arrays under different polarizations as a function of wavelength. Percentage contribution of heat generation in disks 1 and 2 to the total heat generation of MDH arrays under -polarized illumination (b) and -polarized illumination (c). (d) Heat generation at wavelengths under different polarizations.
The double SLRs excited by -polarized incident light have more attractive application prospects than the single SLR excited by -polarized incident light. Therefore, our further studies are restricted to -polarized optical excitations.
C. Wavelength-Dependent Spatial–Temporal Temperature and Velocity Distributions
According to Eq. (1), the photoinduced heat generation depends on the resonance frequency. Therefore, we illuminate the MDH array with a -polarized plane wave at resonance frequencies around 679 nm and 775 nm to investigate the wavelength-dependent spatial–temporal temperature and velocity distributions of the MDH. First, Fig. 5 depicts the wavelength-dependent spatial properties. Figures 5(a) and 5(b) show schematics of and planes marked at three different locations. These planes pass through the center of disks 1 and 2, and between the two disks of the MDH, respectively. The parametric dependence of the spatial temperature distribution under different illumination wavelengths is shown in Figs. 5(c)–5(f). The results specifically show the incident wavelength-dependent spatial modulation of the nanoscale heating source. More specifically, at 679 nm, the temperature of disk 1 is much higher than that of disk 2. At 775 nm, the temperature of disk 1 is slightly lower than that of disk 2. These results confirm that dual SLRs can induce a spatial variation of temperature by active wavelength control and subsequently can induce controlled thermal convection in opposite directions.
Figure 5.Wavelength-dependent spatial axial temperature and velocity distributions in MDH. Schematic of the (a) plane and (b) plane marked with three lines of MDH. Temperature distributions of MDH under different incident wavelengths along the (c) direction and (d) direction. Temperature distributions of MDH along three different directions (lines 1, 2, and 3) at (e) 679 nm and (f) 775 nm. Velocity component distributions of MDH under different incident wavelengths along the (g) direction (, ), (h) direction (, ), and (i) direction (line 2). All data are acquired when the system reaches a steady state. The maximum temperatures along lines 1, 2, and 3 are 51.9°C, 45.5°C, and 41.1°C at 679 nm incident wave, and the maximum temperatures along lines 1, 2, and 3 are 39.4°C, 42.2°C, and 45.7°C at 775 nm incident wave, respectively.
Figure 5(c) shows that the maximum thermal energy is concentrated on disks 1 and 2 with a fairly uniform temperature distribution over the surface of the disks. This is due to the much higher thermal conductivity of Au with respect to its surrounding [58]. Similarly, from the wavelength-dependent spatial velocity distribution part [Figs. 5(g)–5(i)], one can see that the fluid convection appears at different velocities under different illumination wavelengths. Figure 5(i) plots the evolution of the fluid velocity component (measured at line 2) along the normal direction (as a function of the position). The velocity in the fluid along the direction exhibits an asymmetric Gaussian profile with a maximum velocity around . Please note that when the height of the fluid chamber changes, it still follows the same Gaussian trend, but the position of the maximum velocity will change accordingly with the change in the height of the fluid chamber. Figures 5(g) and 5(h) show the evolution of the fluid velocity component (measured at ) as a function of and positions, respectively. In Fig. 5(g), the fluid velocity changes from positive to negative values along the direction (, ), for cases of excitation light at both 679 nm and 775 nm. It is worth noting that the sections marked with dashed and solid purple lines indicate that the fluid velocity reverses between the case of excitation light at 679 nm and 775 nm. In Fig. 5(h), the fluid velocity changes from positive values to negative values along the direction (, ), for cases of excitation light at both 679 nm and 775 nm. The maximum velocity occurs in between the two disks. It is due to the heat transfer from the two asymmetric disks to the surrounding fluid. Since the maximum temperature (of disk 1) at the incident wavelength of 679 nm is higher than that (of disk 2) at 775 nm, the fluid velocity of the optofluidic system is also relatively faster at 679 nm irradiation than that at 775 nm.
The wavelength-dependent temporal temperature and velocity distributions of the MDH are shown in Fig. 6. The transient variation in the temperature of the two disks is shown in Figs. 6(a) and 6(b). The rate at which the fluid can be heated and optically driven is studied from the transient characteristics of the average temperature and the velocity of the fluid [Figs. 6(c) and 6(d)]. One can observe that the transient change in the velocity and temperature depends not only on the area of fluid over the nanoscale heater but also on the laser wavelength. Interestingly, with the increase of time, the temperature of the two disks and fluid gradually reaches a steady state at around 2 μs. The time-varying temperature behavior of fluid can be explained by [13] where is environment temperature, is the thermal conductivity coefficient from fluid to the external environment, and are the incident light flux and the surface area exposed to radiation absorbance, respectively, is the photothermal conversion efficiency of the optofluidic system, is a fitting coefficient that can be obtained through specific experiment, and and refer to the irradiation time and specific heat capacity of the solution, respectively. So when the irradiation time is long enough, there will be , and the temperature will reach a steady state. Additionally, the transient behavior of the velocity and temperature of the fluid evolves at a characteristic rate related to the steady-state profile of temperature and velocity in the same order as discussed in detail by Donner et al [14].
Figure 6.Wavelength-dependent temporal temperature and velocity distributions in MDH. (a) Temperature of two disks as a function of time at 679 nm. (b) Temperature of two disks as a function of time at 775 nm. (c) Average temperature and velocity of the fluid as a function of time at 679 nm. (d) Average temperature and velocity of the fluid as a function of time at 775 nm.
The spatial and temporal variations in temperature and velocity at the two SLR excitation wavelengths shown in Figs. 5 and 6 fully reflect the potential for an active modulation of the functionality of the MDH. Furthermore, the polarization state of incident light can be used to actively modulate the spatiotemporal change in temperature and velocity of the fluid, as shown in Appendix C. These figures show the fluid behavior for -polarized incident light. Thus, a novel optically driven non-contact mechanism for effectively heating and shifting the location of the heat source by modifying the color and polarization of the incident light source can be realized. It opens up a new method for developing flexible platforms in microfluidics applications.
D. Geometric Parametrization of the MDH-SLR
The lattice characteristics of the metasurface can modify the photothermal efficiency and the range of the thermal transport of fluid in a plasmonic SLR device. As with conventional SLRs, geometric parameters such as the lattice constant, scatterer dimension, heterodimer gap, and diameters of the heterodimer play a significant role in the thermal properties and fluid dynamics. Figures 7(a), 7(c), 7(e), and 7(g) show the extinction spectra as a function of the periodicity, gap, and diameters of the MDH. Figure 7(a) shows that as the period increases, the (, 0), (0, ), and (, ) RAs are excited and redshifted [the corresponding positions obtained from Eq. (6) are shown in dashed white and gray lines]. When the light is normally incident on the square lattice, (, 0), (0, ) RAs are degenerate and coincide. The positions of the dual SLRs also exhibit a redshift due to the redshift of (0, ) and (0, ) RAs. Figure 7(c) shows that the dual SLR wavelengths are almost constant as the gap increases. It is attributed to an increase in the gap that does not substantially affect two oscillations along the direction. Moreover, a change in the isolated disk dimension will modify the symmetry of the MDH and thus change the extinction spectra. As revealed in Fig. 7(e), when the diameter of disk 1, , increases while disk 2, , remains unchanged at 120 nm, the SLR wavelength changes significantly. When is small, the intensity of mode I, which is dominated by disk 1, is also lower. As increases, mode I redshifts and increases in intensity. As it approaches the value of , the asymmetry is reduced, and mode II intensity gradually decreases. When equals , the heterodimer becomes a homodimer, resulting in the existence of an SM. Similarly, in Fig. 7(g), when the diameter of disk 2, , increases while disk 1, , remains unchanged at 80 nm, the SLR wavelength changes strikingly. When is similar to , the heterodimer becomes a homodimer, so only SM exists. With the gradual increase of , the asymmetry increases, and two SLR modes appear, which can be interpreted as mode splitting caused by plasmon hybridization. As continues to increase, mode II significantly redshifts with increased intensity. Besides geometric parameters, the effect of incident angles on the extinction spectra is also investigated in Appendix D.
Figure 7.Flexibility of resonance wavelength, temperature, and velocity. (a) Extinction spectra plotted as a function of wavelengths and periods. (b) Ratio of the temperature difference and fluid velocity of resonance mode I to mode II as a function of periods. (c) Extinction spectra plotted as a function of wavelengths and gaps. (d) Ratio of the temperature difference and fluid velocity of resonance mode I to mode II as a function of gaps. (e) Extinction spectra plotted as a function of wavelengths and diameters of disk 1. (f) Ratio of the temperature difference and fluid velocity of resonance mode I to mode II as a function of . (g) Extinction spectra plotted as a function of wavelengths and diameters of disk 2. (h) Ratio of the temperature difference and fluid velocity of resonance mode I to mode II as a function of .
The dual SLRs’ geometric parameters also regulate the temperature and fluid velocity. The ratio of the temperature difference and fluid velocity of resonance mode I to II has been plotted to demonstrate the controllability. Since the two disks have different surface temperatures under different resonance modes, we take only the absolute value of the temperature difference between the two disks in different resonance modes. As shown in Figs. 7(b), 7(d), 7(f), and 7(h), the ratios of the temperature difference and the fluid velocity are investigated. represents the absolute value of temperature difference between the two disks, denotes the fluid velocity, and subscripts I and II represent resonance modes I and II. The value of indicates the ability of dual SLRs to adjust the surface temperature on the two disks (see orange lines and symbols). The value of shows the ability of dual SLRs to adjust the fluid velocity in the optofluidic system (see green lines and symbols).
Specifically, the value of decreases with the increase of period and gap [Figs. 7(b) and 7(d)]. It implies that mode I has a greater ability to regulate the surface temperatures of both disks than mode II at a smaller period and gap. At a larger period and gap, the situation is the opposite: mode II has a greater ability than mode I to regulate the surface temperatures of both disks. Moreover, it is observed from Fig. 7(b) that the ratio of temperature change () follows the same trend as that of the change in velocity with the increasing lattice constant or periodicity of the plasmonic crystal. The difference in temperature and its effect on the fluid flow rate are not observed for periodicity less than 480 nm. However, the fluid flow rate is independent of the plasmon gap or the distance between the dimers, as shown in Fig. 7(d). It implies that the periodicity of the lattice has a stronger ability to regulate the fluid velocity than the gap. The dimension of the scatterer or the isolated disk diameter also affects and . As shown in Fig. 7(f), first increases and then rapidly decreases with the value of ; first increases slowly with and then increases rapidly when increases to 110 nm. These phenomena can be explained as follows: when , the intensity of mode I is much lower than that of mode II; thus, the values of and are both less than one, i.e., mode II has a stronger ability to regulate optical heating and thermal convection than mode I at . Since the absorption intensity increases with from 70 nm to 110 nm, mode I gradually becomes stronger in adjusting optical heating and thermal convection than mode II. A special case where double SLRs decompose into a single SLR occurs when equals , i.e., 120 nm. Figure 7(h) shows that and first decrease, then increase with the value of . It is noteworthy that the values of and are larger than one, indicating that mode I has a stronger ability to regulate optical heating and thermal convection than mode II when varies within a range from 80 nm to 160 nm. Also, a special case occurs when equals , i.e., 80 nm, where the double SLRs can be switched to a single SLR.
4. CONCLUSION
In conclusion, active and reversed spatial control of optical heating and thermal convection are realized on a plasmonic metasurface with heterodimer lattices by illuminating different light wavelengths or polarized states. Corresponding experimental possibilities are discussed in Appendix F. Thermodynamical and hydrodynamical results show that the different heat sources can be switched on and off. Thus inhomogeneous heat distributions at the nanoscale and spatial convective fluid distributions in a part of the region are obtained. Wavelength-dependent spatial and temporal temperature and velocity distributions of MDH are also investigated to demonstrate the controlled optical heating and thermal convection. Importantly, analytical and numerical results elucidate that the mechanism behind the regulation is the excitation of SLRs. The selectivity of the excitation wavelength can also control the spatiotemporal flow of the fluid. Additionally, the effects of geometric parameters on SLRs and corresponding photoinduced heat generation and thermally induced fluid motion are also analyzed. Our results highlight the controllable thermo-plasmonics potential of SLR-based metasurfaces and expand the capabilities of SLR-based metasurfaces for microfluidic applications.
APPENDIX A: SIMULATION SETTING METHOD
By coupling the “electromagnetic waves, frequency domain,” “heat transfer in solids and fluids,” and “laminar flow” modules, the Multiphysics calculations are performed in a unit cell of the array. Periodic boundary conditions (PBCs) applied to and side boundaries are utilized in the “electromagnetic waves, frequency domain” and “heat transfer in solids and fluids” modules. Open boundary conditions (OBCs) are used as flow conditions in the “laminar flow” module. As shown in Fig. 8, no-slip wall conditions are applied in the boundaries of the solid–liquid. is set at port 1 and port 2. The incident plane wave illuminates the MDH from port 1. The transmission light is collected at port 2. Perfectly matched layers (PMLs) are used at the top of the port 1 domain and the bottom of the port 2 domain, simulating the behavior of infinite dielectric domains in the vertical direction. The thermal parameters of the fluid and substrate derive from the relevant parameters of water solution of NaCl and in the built-in COMSOL Materials Library [59]. The refractive index of the fluid and substrate is set as 1.46. The viscosity of the fluid is at . For calculation of buoyancy force, the dilatation coefficient of fluid is , and gravitational acceleration is . The optical and thermal properties of the materials used in the calculations are listed in Table 1.
Figure 8. cross-sectional view of the model used in the simulation of the MDH.
Optical and Thermal Properties of Materials Used in the Calculations
Materials
Thermal Conductivity [W/(m·K)]
Mass Density []
Specific Heat Capacity [J/(kg·K)]
Refractive Index
Au
318
19320
129
Ref. [53]
Substrate (SiO2)
1.4
2650
840
1.46
Fluid (NaCl)
0.6
2003
1651
1.46
APPENDIX B: SURFACE CHARGE DISTRIBUTIONS OF MDH
To easily understand the underlying physics of the plasmon hybridization of MDH with different polarizations, surface charge distributions at the resonant wavelength under different polarization conditions are calculated, as shown in Fig. 9. The red and blue parts in Fig. 9 denote the positive and negative charges, respectively. Surface charge distributions indicate that the vertical dipole of disk 1 and the quadrupole of disk 2 are excited at 679 nm [Fig. 9(a)], the vertical dipoles of disk 1 and disk 2 are excited at 775 nm [Fig. 9(b)], and the horizontal dipoles of disk 1 and disk 2 are excited at 786 nm [Fig. 9(c)].
Figure 9.Surface charge distributions of resonance modes for different illuminated polarizations. Surface charge distributions of MDH at (a) 679 nm and (b) 775 nm for -polarized excitation case. (c) Surface charge distributions of MDH at 786 nm for -polarized excitation case.
APPENDIX C: SPATIOTEMPORAL TEMPERATURE AND VELOCITY DISTRIBUTIONS FOR X-POLARIZED INCIDENT LIGHT
Wavelength-dependent spatiotemporal temperature and velocity distributions in MDH in the case of an -polarized incident wave are investigated in Figs. 10 and 11. Figure 10 gives the spatial axial temperature and velocity distributions in MDH, and Fig. 11 depicts the temporal temperature and velocity distributions in MDH. All cases are under the incident wavelength of 786 nm. Similar to Figs. 5 and 6, these results reflect that the polarization state of the incident light can also be used to actively modulate the temperature and velocity of the fluid in space and time.
Figure 10.Wavelength-dependent spatial axial temperature and velocity distributions in MDH in the case of -polarized incident wave. (a) Temperature distributions of MDH along the direction (, ). (b) Velocity component distributions of MDH along the direction (, ). (c) Temperature distributions of MDH along the direction (, ). (d) Velocity component distributions of MDH along the direction (, ). (e) Temperature distributions of MDH along different directions (lines 1, 2, and 3). (f) Velocity component distributions of MDH along the direction (line 2). Schematics of the plane and plane marked with three lines of MDH are shown in Figs. 5(a) and 5(b). The maximum temperatures along lines 1, 2, and 3 are 38.0°C, 39.6°C, and 42.0°C at 786 nm incident wave, respectively.
Figure 11.Wavelength-dependent temporal temperature and velocity distributions in MDH in the case of -polarized incident wave. (a) Temperature of two disks as a function of time under the incident wavelength of 786 nm. (b) Average temperature and velocity of fluid as a function of time under the incident wavelength of 786 nm.
APPENDIX D: SPATIOTEMPORAL TEMPERATURE AND VELOCITY DISTRIBUTIONS
Besides geometric parameters, the effect of incident angles on the extinction spectra is also investigated. Figure 12 shows the angle at which the transition from SM to multimode SLR can be realized. Thus, the momentum conservation of the MDH-SLR structure can be applied for regulating temperature and fluid velocity and opening up routes for the multimode operation of nanolasers.
Figure 12.Extinction spectra of the MDH with different incident angles of , 2°, 4°, 6°, 8°, 10°. With the increase of , mode II exhibits an obvious redshift, mode I gradually splits, and more new modes appear. It is conceivable that this phenomenon will inevitably lead to the flexibility of optical heating and thermal convection.
APPENDIX E: PHOTOTHERMAL HEATING AND THERMAL CONVECTION RESPONSE AT MACROSCOPIC SCALE
To observe the photothermal heating and thermal convection response of the MDH array system, we calculate the temperature and fluid convection patterns under different incident wavelengths and polarizations at a macroscopic scale. To save computing time and resources, the results of a array of MDH are summarized in Fig. 13. There will still be obvious differences for both the temperature magnitude and streamline distributions when different disks in the heterodimer are excited under different illuminating cases at . More specifically, due to the inhomogeneity of the temperature distribution, the local streamlines near the heated disk (disk 1 under 679 nm, -polarized light excitation case; disk 2 under 775 nm, -polarized light excitation case; and disk 2 under 786 nm, -polarized light excitation case) are slightly disturbed. With the increase of irradiation time, the heat will gradually spread at μ, the temperature distributions of the system under both cases will show relatively small inhomogeneity, and the streamlines will present Raleigh–Benard-like fluid convection. Even so, there are still differences in the magnitude of temperature for different incident cases.
Figure 13.Temperature and fluid convection patterns under different incident wavelengths and polarizations of array of MDH. The data are given at different illumination times (, 1000 ns).
The experimental setup for thermal convection flow refers to that used in some previous studies [60–62]. The thermo-plasmonic device can be driven using a diffraction-limited or super-resolution microscope. The motion of the fluid can be simultaneously observed under white light illumination. The collimated or focused beam from the microscope incident on the heterodimer disk can be used to generate the convection flow. A fast dynamic CMOS camera can be used to record the fluid flow and the convection pattern.
Considering that a high fluid velocity is in demand for practical applications, a higher microfluidic chamber is required in the experiment because the fluid flow rate increases with the height of the fluid column based on the length of the microfluidic channel. To observe the change in the convective flow within the microfluidic chamber, the maximum height and radius of the liquid chamber can be 50 μm at the magnitude of the current size of the structure [14]. In addition, in an actual microfluidic channel, with finite boundary conditions, the fluid flow in a restrictive dimension along the plane can be higher due to the conservation of the mass of fluid flowing within the reduced horizontal dimension. The dimension of the fluid pump source can be dictated by the spot size of the incident laser beam that drives the convective flow of the fluid. Consequently, measured velocities can be much larger than the simulation values.
In terms of illumination time, as the time changes from the order of ns to the order of μs, the system gradually tends to a steady state. The system will eventually display similar Raleigh–Benard-like fluid convection, but with different magnitudes of temperature, under different excitation cases. Given this, we can use a periodic nanosecond pulse laser as the fluid pump source to achieve wavelength- and polarization-controlled temperature and flow field distribution. In general, the demonstration and quantification of this thermally actuated convection provide the feasibility for optical control of the plasmon-assisted experiment, such as driving and trapping.
[28] X. Miao, L. Y. Lin. New opto-plasmonic tweezers for manipulation and rotation of biological cells-design and fabrication. International Conference of the IEEE Engineering in Medicine and Biology Society, 4318-4321(2006).