
Xiaotian Feng, Zhifei Yu, Bing Chen, Shuying Chen, Yuan Wu, Donghui Fan, Chun-Hua Yuan, L. Q. Chen, Z. Y. Ou, Weiping Zhang, "Reducing the mode-mismatch noises in atom–light interactions via optimization of the temporal waveform," Photonics Res. 8, 1697 (2020)
- Photonics Research
- Vol. 8, Issue 11, 1697 (2020)
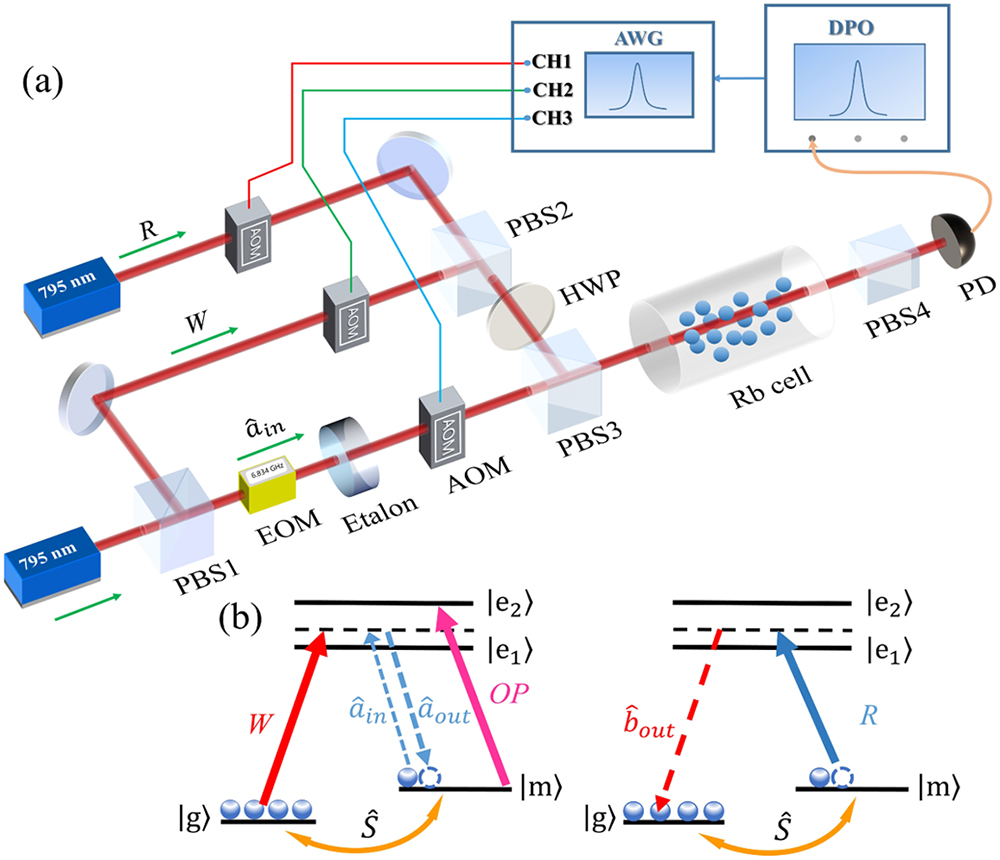
Fig. 1. (a) Schematic of the experimental setup. PBS, polarized beam splitter; HWP, half-wave plate; EOM, electro-optic modulator; AOM, acousto-optic modulator; PD, photodetector; AWG, arbitrary wave generator; DPO, digital phosphor oscilloscope. (b) Energy levels of the Rb 87 | g , m ⟩ | 5 2 S 1 / 2 , F = 1 , F = 2 ⟩ | e 1 , e 2 ⟩ | 5 2 P 1 / 2 , F = 2 ⟩ | 5 2 P 3 / 2 ⟩ W a ^ in a ^ out S ^ R b ^ out
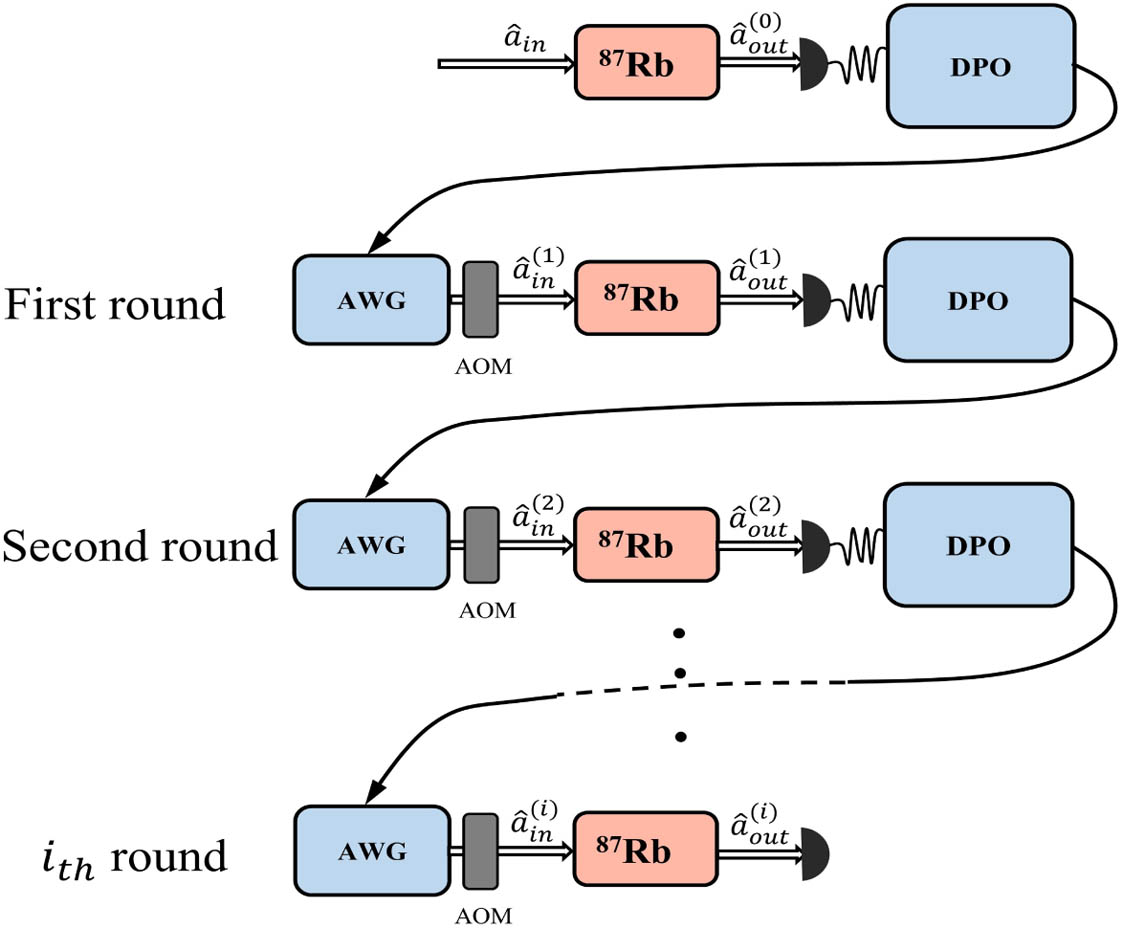
Fig. 2. Iteration diagram. a ^ in , a ^ in ( 1 ) , … , a ^ in ( i ) a ^ out , a ^ out ( 1 ) , … , a ^ out ( i ) i
Fig. 3. (a) and (b) a ^ in a ^ out ( 0 ) a ^ out ( 1 ) a ^ out ( 1 ) a ^ out ( f ) a ^ in
Fig. 4. (a) and (b) The different energy fluctuations Δ E a ^ out ( 0 ) a ^ out ( 0 ) Δ E a ^ out ( f ) a ^ out ( f ) E ¯ a ^ out Var ( E ) E a ^ out ( 0 ) E a ^ out ( f ) W
Fig. 5. Black square and red triangle curves are respective Var ( E Diff ) a ^ out ( 0 ) a ^ out ( f ) W R


Set citation alerts for the article
Please enter your email address

© Copyright 2018-2021 | Chinese Laser Press. All Rights Reserved 沪ICP备15018463号-20