• Photonics Research
  • Vol. 8, Issue 9, 1457 (2020)
Jan Wiersig*
Author Affiliations
  • Institut für Physik, Otto-von-Guericke-Universität Magdeburg, Postfach 4120, D-39016 Magdeburg, Germany (jan.wiersig@ovgu.de)
  • show less
    DOI: 10.1364/PRJ.396115 Cite this Article Set citation alerts
    Jan Wiersig. Review of exceptional point-based sensors[J]. Photonics Research, 2020, 8(9): 1457 Copy Citation Text show less
    Illustration of the enhanced frequency splitting induced by perturbing a non-Hermitian Hamiltonian at an exceptional point of second order (red curve) compared to the case of a conventional degeneracy (blue dash-dotted curve). In both cases, the same perturbation has been applied. (a) Splitting versus perturbation strength ε. (b) Spectra for fixed ε designated by the vertical line in (a). The double-arrowed lines indicate the splitting, which is considerably larger for the exceptional point.
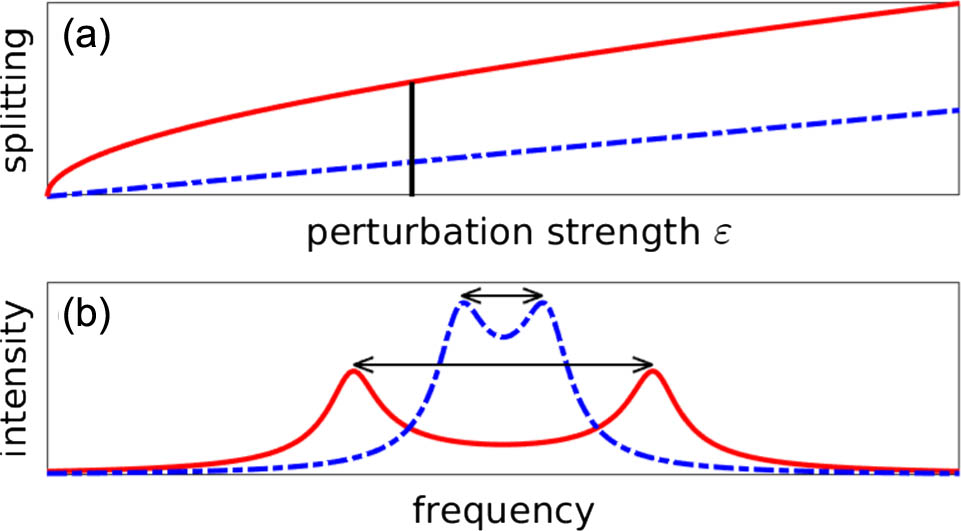
    Fig. 1. Illustration of the enhanced frequency splitting induced by perturbing a non-Hermitian Hamiltonian at an exceptional point of second order (red curve) compared to the case of a conventional degeneracy (blue dash-dotted curve). In both cases, the same perturbation has been applied. (a) Splitting versus perturbation strength ε. (b) Spectra for fixed ε designated by the vertical line in (a). The double-arrowed lines indicate the splitting, which is considerably larger for the exceptional point.
    Two proposals for EP-based sensors. (a) Microdisk cavity with two external scatterers (particles or nano-tips on the right) which implement an EP2 by generating fully asymmetric backscattering. As a result, only one mode [here counterclockwise (CCW) propagating] of the given mode pair exists. A target particle shown on the left induces additional backscattering, leading to an enhanced frequency splitting. (b) PT-symmetric pair of microrings, one with gain (ring 1) and one with loss (ring 2).
    Fig. 2. Two proposals for EP-based sensors. (a) Microdisk cavity with two external scatterers (particles or nano-tips on the right) which implement an EP2 by generating fully asymmetric backscattering. As a result, only one mode [here counterclockwise (CCW) propagating] of the given mode pair exists. A target particle shown on the left induces additional backscattering, leading to an enhanced frequency splitting. (b) PT-symmetric pair of microrings, one with gain (ring 1) and one with loss (ring 2).
    Various experimental realizations of EP-based sensors. (a) Optical image of a microtoroidal cavity together with a fiber-taper waveguide and three nano-tips for particle detection. Reprinted by permission from Springer Nature: Nature [73], copyright 2017. (b) Illustration and SEM (scanning electron microscope) image of a PT-symmetric ternary microring system for thermal sensing; inset exposes the heating elements underneath each cavity for fine-tuning and thermal perturbation. Reprinted by permission from Springer Nature: Nature [74], copyright 2017. (c) Sketch of a ring laser gyroscope with three mirrors, a Faraday rotator (FR), a half-wave plate (HWP), two Brewster windows (BW), and a He–Ne gas tube as gain medium. Reprinted by permission from Springer Nature: Nature [80], copyright 2019. (d) Computed tomography reconstruction of a wireless PT-symmetric microsensor implanted in a rat abdomen. Reprinted by permission from Springer Nature: Nature Electronics [78], copyright 2019. (e) Schematics and optical image of the thermo-sensitive microscope slide for thermal mapping; from Ref. [75]. (f) Illustration of a laser gyroscope with stimulated Brillouin laser (SBL) action pumped optically at two different frequencies ωp1 and ωp2 via an attached waveguide which induces backscattering with rate κ. Reprinted by permission from Springer Nature: Nature [81], copyright 2019.
    Fig. 3. Various experimental realizations of EP-based sensors. (a) Optical image of a microtoroidal cavity together with a fiber-taper waveguide and three nano-tips for particle detection. Reprinted by permission from Springer Nature: Nature [73], copyright 2017. (b) Illustration and SEM (scanning electron microscope) image of a PT-symmetric ternary microring system for thermal sensing; inset exposes the heating elements underneath each cavity for fine-tuning and thermal perturbation. Reprinted by permission from Springer Nature: Nature [74], copyright 2017. (c) Sketch of a ring laser gyroscope with three mirrors, a Faraday rotator (FR), a half-wave plate (HWP), two Brewster windows (BW), and a He–Ne gas tube as gain medium. Reprinted by permission from Springer Nature: Nature [80], copyright 2019. (d) Computed tomography reconstruction of a wireless PT-symmetric microsensor implanted in a rat abdomen. Reprinted by permission from Springer Nature: Nature Electronics [78], copyright 2019. (e) Schematics and optical image of the thermo-sensitive microscope slide for thermal mapping; from Ref. [75]. (f) Illustration of a laser gyroscope with stimulated Brillouin laser (SBL) action pumped optically at two different frequencies ωp1 and ωp2 via an attached waveguide which induces backscattering with rate κ. Reprinted by permission from Springer Nature: Nature [81], copyright 2019.
    Results on the microtoroidal sensor in the experiment of Chen et al. [73]. The transmission spectra of a DP-based sensor (a) before and (b) after adsorption of a target particle on the surface of the cavity. The transmission spectra of an EP-based sensor (c) before and after (d) adsorption of the same target particle. The blue arrows illustrate the symmetric backscattering at the target particle, and the red arrow marks the fully asymmetric backscattering related to the EP. The dashed vertical lines in (b) and (d) pinpoint the resulting frequency splitting. (e) Measured splitting enhancement factor versus perturbation strength ε. The double logarithmic plot in the inset displays the two different splittings versus ε. The DP-based sensor (red circles) exhibits a slope of 1, whereas the EP-based sensor (blue squares) exhibits a slope of 1/2 (solid black line) for sufficiently small perturbations, confirming the square-root behavior at an EP2. Reprinted by permission from Springer Nature: Nature [73], copyright 2017.
    Fig. 4. Results on the microtoroidal sensor in the experiment of Chen et al. [73]. The transmission spectra of a DP-based sensor (a) before and (b) after adsorption of a target particle on the surface of the cavity. The transmission spectra of an EP-based sensor (c) before and after (d) adsorption of the same target particle. The blue arrows illustrate the symmetric backscattering at the target particle, and the red arrow marks the fully asymmetric backscattering related to the EP. The dashed vertical lines in (b) and (d) pinpoint the resulting frequency splitting. (e) Measured splitting enhancement factor versus perturbation strength ε. The double logarithmic plot in the inset displays the two different splittings versus ε. The DP-based sensor (red circles) exhibits a slope of 1, whereas the EP-based sensor (blue squares) exhibits a slope of 1/2 (solid black line) for sufficiently small perturbations, confirming the square-root behavior at an EP2. Reprinted by permission from Springer Nature: Nature [73], copyright 2017.
    Fundamental limit of an EP-based laser gyroscope due to excess quantum noise [94]. (a) Measured stimulated Brillouin laser (SBL) beating frequency versus pump detuning (which determines the frequency detuning of the uncoupled SBL modes) for different locking zones. The inset shows an Allan deviation measurement of frequency σν versus gate time τ. (b) Measured white frequency noise of the beating signal determined using the Allan deviation measurement. The linewidth enhancement factor [Petermann factor (PF), solid curves] and the noise enhancement factor (NEF, dashed curves) are theoretical predictions. The figure is taken from Ref. [94].
    Fig. 5. Fundamental limit of an EP-based laser gyroscope due to excess quantum noise [94]. (a) Measured stimulated Brillouin laser (SBL) beating frequency versus pump detuning (which determines the frequency detuning of the uncoupled SBL modes) for different locking zones. The inset shows an Allan deviation measurement of frequency σν versus gate time τ. (b) Measured white frequency noise of the beating signal determined using the Allan deviation measurement. The linewidth enhancement factor [Petermann factor (PF), solid curves] and the noise enhancement factor (NEF, dashed curves) are theoretical predictions. The figure is taken from Ref. [94].