• Infrared and Laser Engineering
  • Vol. 51, Issue 4, 20210333 (2022)
Wentao Tian, Weicheng Liu, Xuhui Sun, Hongyu Zheng, and Zhiwen Wang
Author Affiliations
  • School of Mechanical Engineering, Shandong University of Technology, Zibo 255000, China
  • show less
    DOI: 10.3788/IRLA20210333 Cite this Article
    Wentao Tian, Weicheng Liu, Xuhui Sun, Hongyu Zheng, Zhiwen Wang. Process on ethanol assisted laser ablation dicing of silicon wafer[J]. Infrared and Laser Engineering, 2022, 51(4): 20210333 Copy Citation Text show less
    Schematic diagram of laser dicing system
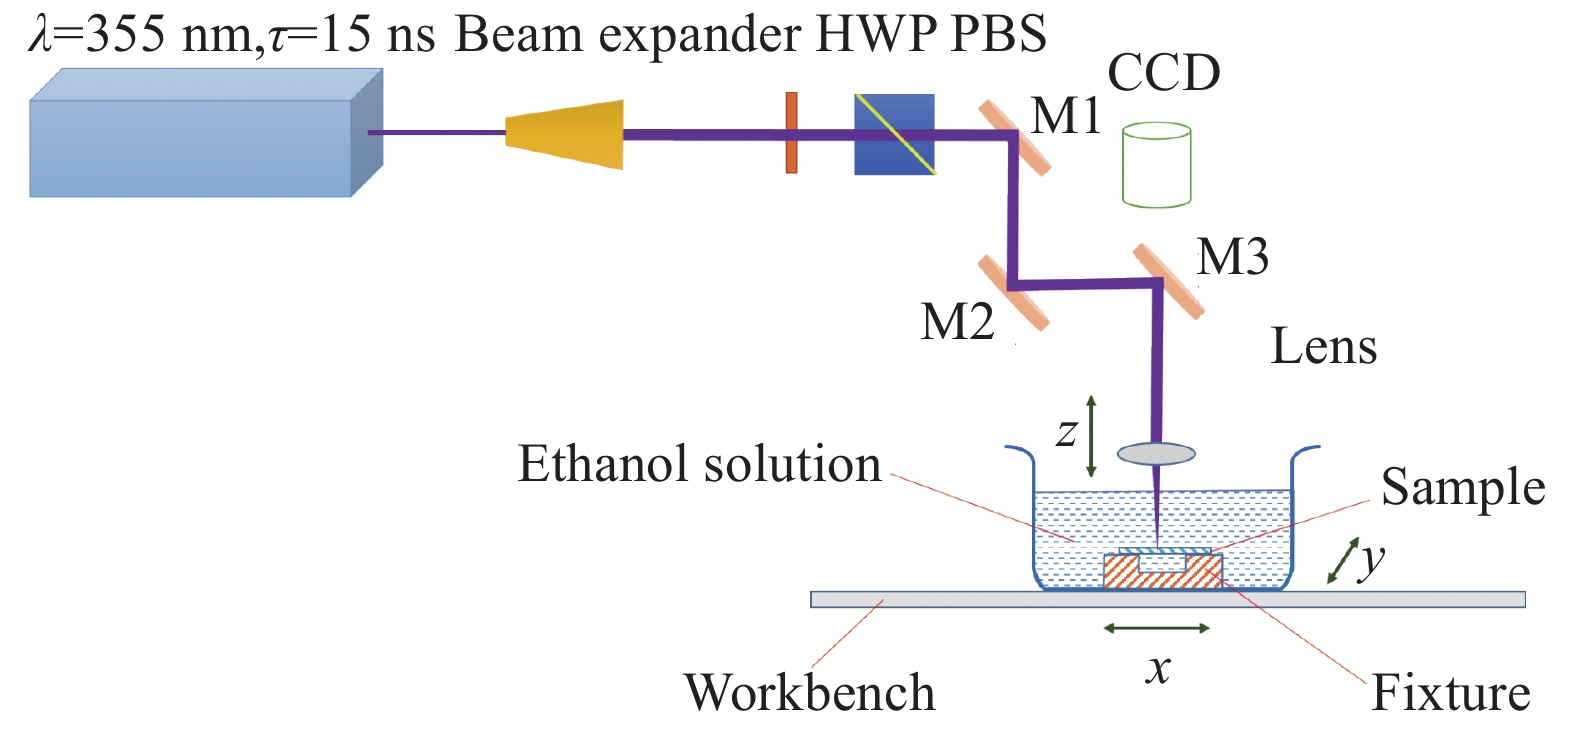
    Fig. 1. Schematic diagram of laser dicing system
    Definition of kerf width and ablated zone
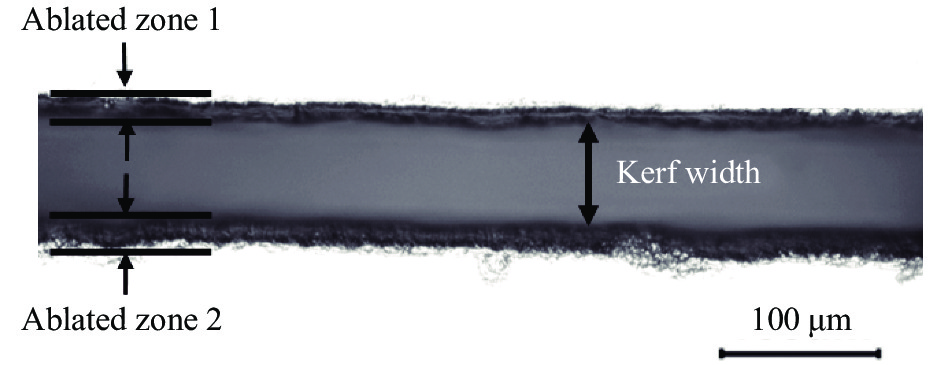
    Fig. 2. Definition of kerf width and ablated zone
    Definition of affected zone width
    Fig. 3. Definition of affected zone width
    Change trend of dicing silicon under pure water. (a) Change trend of kerf width vs speed and frequency; (b) Change trend of ablated zone vs speed and frequency
    Fig. 4. Change trend of dicing silicon under pure water. (a) Change trend of kerf width vs speed and frequency; (b) Change trend of ablated zone vs speed and frequency
    Optical image of the grooves on the rear side of silicon
    Fig. 5. Optical image of the grooves on the rear side of silicon
    Surface of silicon diced under water. (a) Silicon surface impacted by bubbles collapse; (b) Enlarged optical image of area B; (c) The first enlarged optical image of area A; (d) The second enlarged optical image of area A
    Fig. 6. Surface of silicon diced under water. (a) Silicon surface impacted by bubbles collapse; (b) Enlarged optical image of area B; (c) The first enlarged optical image of area A; (d) The second enlarged optical image of area A
    Bubbles adhering on the surface of the silicon diced in different ethanol-water mixtures with ethanol in water of 0 wt.% (a), 2 wt.% (b), 3.5 wt.% (c), 5 wt.% (d)
    Fig. 7. Bubbles adhering on the surface of the silicon diced in different ethanol-water mixtures with ethanol in water of 0 wt.% (a), 2 wt.% (b), 3.5 wt.% (c), 5 wt.% (d)
    Optical images of front surface diced in different ethanol-water mixtures with ethanol in water of 0 wt.% (a), 2 wt.% (b), 3.5 wt.%(c), 5 wt.% (d)
    Fig. 8. Optical images of front surface diced in different ethanol-water mixtures with ethanol in water of 0 wt.% (a), 2 wt.% (b), 3.5 wt.%(c), 5 wt.% (d)
    Optical images of rear surface diced in different ethanol-water mixtures with ethanol in water of 0 wt.% (a), 2 wt.% (b), 3.5 wt.% (c), 5 wt.% (d)
    Fig. 9. Optical images of rear surface diced in different ethanol-water mixtures with ethanol in water of 0 wt.% (a), 2 wt.% (b), 3.5 wt.% (c), 5 wt.% (d)
    Change trend of dicing silicon in ethanol solution. (a) Cut width (characterized by 'Kerf width + affected zone width') of polished surface of silicon vs ethanol concentration; (b) Cut width of non-polished surface of silicon vs vs ethanol concentration
    Fig. 10. Change trend of dicing silicon in ethanol solution. (a) Cut width (characterized by 'Kerf width + affected zone width') of polished surface of silicon vs ethanol concentration; (b) Cut width of non-polished surface of silicon vs vs ethanol concentration
    Morphology of rear surface diced with different ethanol concentrations. (a) 0 wt.%; (b) 2 wt.%
    Fig. 11. Morphology of rear surface diced with different ethanol concentrations. (a) 0 wt.%; (b) 2 wt.%
    Optical images of polished-surface of silicon diced with different ethanol concentrations. (a) 0 wt.%; (b) 2 wt.%
    Fig. 12. Optical images of polished-surface of silicon diced with different ethanol concentrations. (a) 0 wt.%; (b) 2 wt.%
    Lateral side view of silicon diced with different ethanol concentrations. (a) 0 wt.%; (b) 2 wt.%; (c) 3.5 wt.%; (d) 5 wt.%
    Fig. 13. Lateral side view of silicon diced with different ethanol concentrations. (a) 0 wt.%; (b) 2 wt.%; (c) 3.5 wt.%; (d) 5 wt.%
    Change line chart between depth and ethanol concentration
    Fig. 14. Change line chart between depth and ethanol concentration
    Dynamics of laser-induced bubble. (a) In deionized water; (b) Under ethanol solution
    Fig. 15. Dynamics of laser-induced bubble. (a) In deionized water; (b) Under ethanol solution
    Relationship between pulse and bubbles. (a) Under pure water; (b) Under ethanol solution
    Fig. 16. Relationship between pulse and bubbles. (a) Under pure water; (b) Under ethanol solution
    GroupAuxiliary mediumFrequency/kHzScanning speed/mm·s−1Cut surfaceThickness of silicon wafer/μm
    ADeionized water10-501-3Polished surface200
    BEthanol solution301Polished surface200
    CEthanol solution301Non-polished surface200
    DEthanol solution301Polished surface400
    Table 1. Parameters of laser dicing process
    Wentao Tian, Weicheng Liu, Xuhui Sun, Hongyu Zheng, Zhiwen Wang. Process on ethanol assisted laser ablation dicing of silicon wafer[J]. Infrared and Laser Engineering, 2022, 51(4): 20210333
    Download Citation