• High Power Laser and Particle Beams
  • Vol. 32, Issue 3, 032003 (2020)
Xiaofeng Liu1、2、3, Yuan’an Zhao1、3, Liping Peng1、3、4, Xiaoshuang Wang5, Dawei Li1、3, and Jianda Shao1、3
Author Affiliations
  • 1Laboratory of Thin Film Optics, Shanghai Institute of Optics and Fine Mechanics, Shanghai 201800, China
  • 2State Key Laboratory of Pulsed Power Laser Technology, National University of Defense Technology, Hefei 230037, China
  • 3Key Laboratory of Materials for High Power Laser, Chinese Academy of Sciences, Shanghai 201800, China
  • 4Center of Materials Science and Optoelectronics Engineering, University of Chinese Academy of Sciences, Beijing 100049, China
  • 5School of Optical and Electronic Information, Huazhong University of Science and Technology, Wuhan 430070, China
  • show less
    DOI: 10.11884/HPLPB202032.190426 Cite this Article
    Xiaofeng Liu, Yuan’an Zhao, Liping Peng, Xiaoshuang Wang, Dawei Li, Jianda Shao. Application problems of liquid crystal phase modulators to high power lasers[J]. High Power Laser and Particle Beams, 2020, 32(3): 032003 Copy Citation Text show less
    Typical damage morphology of ITO/glass at a lower fluence (near the LIDT). (b), (c), and (d) show local magnified views of micro-areas outlined by the rectangles 1, 2, and 3 in (a), respectively
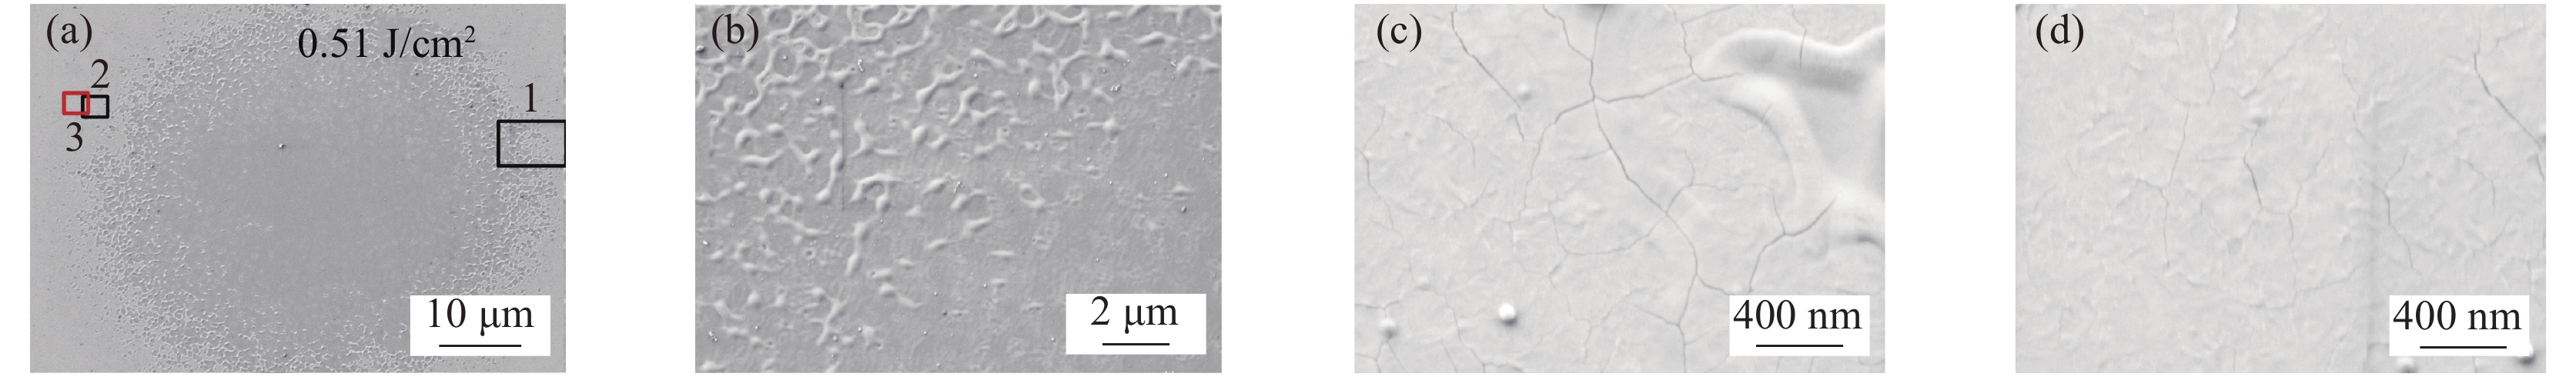
    Fig. 1. Typical damage morphology of ITO/glass at a lower fluence (near the LIDT). (b), (c), and (d) show local magnified views of micro-areas outlined by the rectangles 1, 2, and 3 in (a), respectively
    Typical damage morphology and depth profile of the ITO/glass sample at a higher fluence (near 100% damage probability)
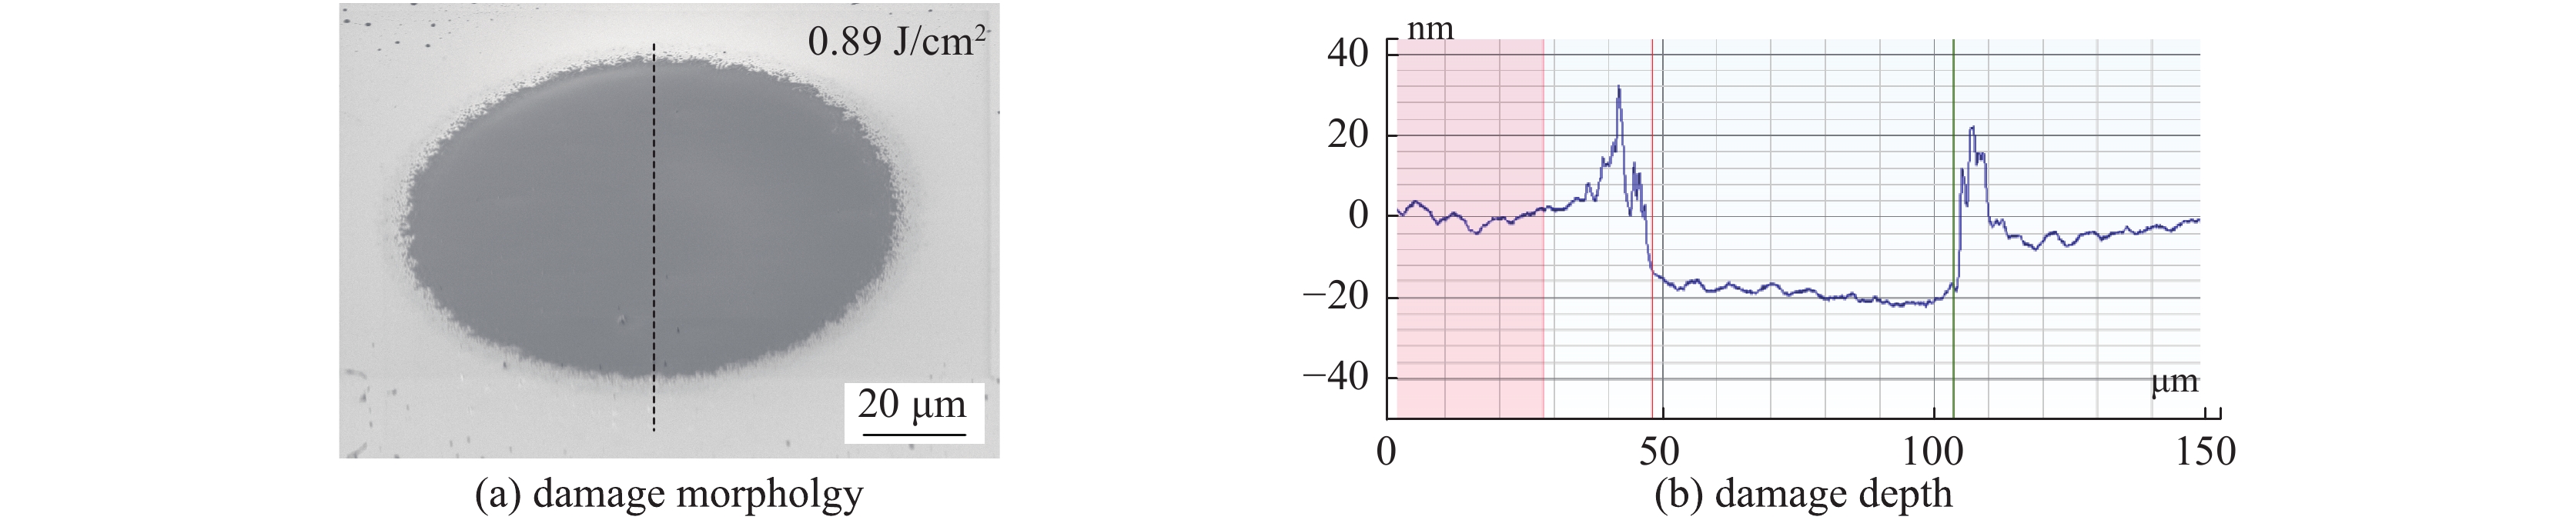
    Fig. 2. Typical damage morphology and depth profile of the ITO/glass sample at a higher fluence (near 100% damage probability)
    Typical damage morphologies of the PI/ITO/glass sample
    Fig. 3. Typical damage morphologies of the PI/ITO/glass sample
    Temperature distribution of the irradiated center in the samples. The dashed lines represent the vaporization temperature of the ITO film
    Fig. 4. Temperature distribution of the irradiated center in the samples. The dashed lines represent the vaporization temperature of the ITO film
    Schematic diagram of measuring phase modulation of the liquid crystal device induced by the high-average-power laser[35]
    Fig. 5. Schematic diagram of measuring phase modulation of the liquid crystal device induced by the high-average-power laser[35]
    Morphologies observed by the polarized light microscope for decrease in the laser power density from 141 W/cm2 to 133 W/cm2
    Fig. 6. Morphologies observed by the polarized light microscope for decrease in the laser power density from 141 W/cm2 to 133 W/cm2
    Transmitted He-Ne light intensity after the analyzer varies with voltage apllied on the liquid crystal device when the liquid crystal device is irridiated by different laser power densities [36]
    Fig. 7. Transmitted He-Ne light intensity after the analyzer varies with voltage apllied on the liquid crystal device when the liquid crystal device is irridiated by different laser power densities [36]
    Damage morphologies induced by different power densities
    Fig. 8. Damage morphologies induced by different power densities
    Vertical temperature distribution in first 30 s under 3 000 W/cm2 laser irradiation
    Fig. 9. Vertical temperature distribution in first 30 s under 3 000 W/cm2 laser irradiation
    Simulation and measurement results of the normalized ransmitted power of the probe laser after the analyzer[37]
    Fig. 10. Simulation and measurement results of the normalized ransmitted power of the probe laser after the analyzer[37]
    Xiaofeng Liu, Yuan’an Zhao, Liping Peng, Xiaoshuang Wang, Dawei Li, Jianda Shao. Application problems of liquid crystal phase modulators to high power lasers[J]. High Power Laser and Particle Beams, 2020, 32(3): 032003
    Download Citation