
Letícia Avellar, Anselmo Frizera, Helder Rocha, Mariana Silveira, Camilo Díaz, Wilfried Blanc, Carlos Marques, Arnaldo Leal-Junior, "Machine learning-based analysis of multiple simultaneous disturbances applied on a transmission-reflection analysis based distributed sensor using a nanoparticle-doped fiber," Photonics Res. 11, 364 (2023)
- Photonics Research
- Vol. 11, Issue 3, 364 (2023)
Abstract
1. INTRODUCTION
The Internet of Things (IoT) has revolutionized the global world by enabling interconnection between several smart devices through wireless communications [1,2]. Photonic-based technology is a potential alternative for next-generation communications systems, which could deliver very high-speed, reliable data transmission. For next-generation sensor systems, photonics-based sensors also offer multiplexing and miniaturization capabilities, especially as a solution for the challenges of IoT technology [3,4]. As an IoT strand, smart cities enable novel technologies to be interconnected to provide high-quality basic services through relevant information, improving the quality and lifestyle of city residents [5]. This concept covers transportation, healthcare, and personal homes/offices [6].
Digital health can be defined as the intersection between digital technology and healthcare services, which includes digital information, data, and communications technologies to collect, share, and analyze health information [7]. The widespread use of digital health technologies has increased in the medical field, motivated by the aging population [8]. When combined with artificial intelligence (AI) technology, digital health technologies can improve diagnosis, treatment, clinical decision support, and care management. In addition, digital health technologies can be scaled to reach thousands of people, which can improve both the clinical health status of patients [9] and healthcare delivery [10], while also reducing the cost of care [7].
The fusion of emerging AI technology with photonic sensors has promoted a new era of intelligent sensing, mitigating impairments in optical systems and resulting in a technology able to perform a more complicated and comprehensive analysis [11]. From physics-inspired optical designs, the future is heading toward data-driven designs that will change both optical hardware and next-generation software systems [12].
Sign up for Photonics Research TOC. Get the latest issue of Photonics Research delivered right to you!Sign up now
Regarding current photonic sensing technology, optical fiber sensors (OFSs) present several intrinsic advantages: OFSs are lightweight, compact, chemically stable, immune to electromagnetic fields and have multiplexing capabilities [13,14]. OFSs are also compatible with the requirements of IoT technology [15], which mainly relies on the wireless connectivity of several miniaturized sensors that offer low energy consumption [16]. The combination of OFS and IoT technologies has had a major impact on the concept of digital health [17,18]. This combination has the potential to produce better outcomes for patients, by providing intelligent health data analytics and guaranteeing preventive medicine and care for the elderly [8], since these sensor systems allow the continuous monitoring of patients’ activities [17], which results in remote assistive services, early detection of health issues, and transport in case of emergencies [19].
OFS can be classified based on spatial positioning, in which the sensors can measure punctually or along the fiber [20]. This classification is divided into three types: punctual, quasi-distributed, or distributed sensors. Punctual sensors provide the value of a physical parameter of interest locally [21], whereas distributed sensors provide the value of a physical parameter over a distance and as a function of the position along the fiber [22]. In quasi-distributed sensors [23], such as the fiber Bragg grating (FBG) sensor systems [24], the variable is measured at discrete points along the fiber.
A distributed OFS is a very attractive approach to locate loss-inducing perturbations along the fiber [25]. The backscattering-based sensing technology is often employed for the localization of a loss-inducing perturbation, in which the two main methods are optical time domain reflectometry (OTDR) [26] and optical frequency domain reflectometry (OFDR) [27]. However, these methods use modulated light sources and demand interrogation systems that are complex and costly [28], which make them impractical for massive deployment and unavailable for the general public.
Transmission-reflection analysis (TRA) is a simple, inexpensive technique developed to locate loss-inducing perturbation based on measurement of the transmitted and backscattered powers of an unmodulated light source [29,30]. Despite its simplicity and low cost, the TRA technique is developed for single perturbation tracking and presents poor spatial resolution (
The cost reduction of distributed OFSs can be useful for applications in fields such as healthcare that involve the general public. To achieve a low-cost distributed system with a spatial resolution of cm, this paper presents the combination of a TRA-based sensor using DNP-doped fiber and AI algorithms, resulting in an AI-integrated optical fiber sensing approach, as shown in Fig. 1. Classification and regression neural network models are designed to characterize the system under multiple simultaneous disturbances using the same (or different) forces. Furthermore, to validate the proposed system in a healthcare application and to close the gap between distributed sensing technology and the general public, the system is embedded in a room simulating a small house to evaluate its ability to identify the position of different people in the environment, resulting in cutting-edge technology accessible to the general population.
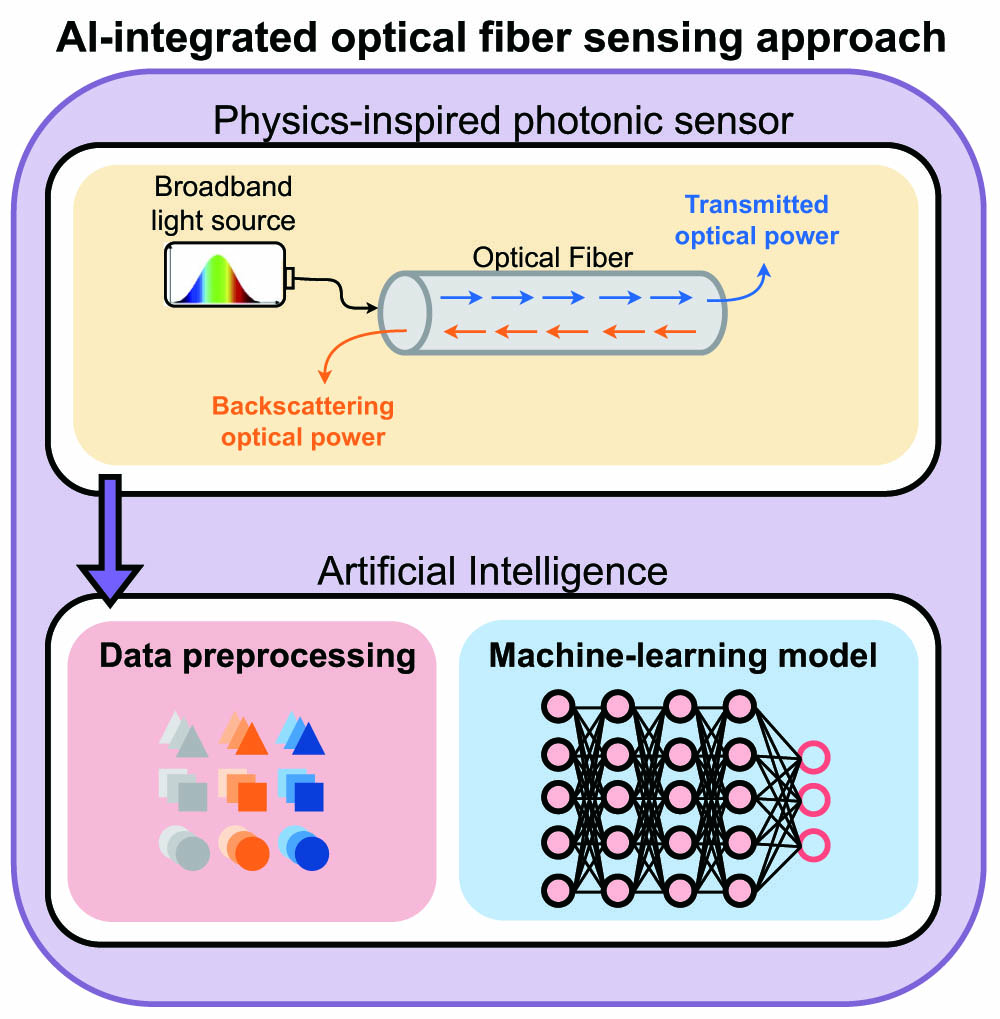
Figure 1.AI-integrated optical fiber sensing approach as a result of the combination of a photonics sensor and machine learning.
2. MATERIALS AND METHODS
The materials used in this setup are divided into three parts: the light source, the acquisition system, and the optical fibers. The superluminescent diode (SLED) centered at 1550 nm with a bandwidth of 60 nm (DL-BP1-1501A, Ibsen Photonics, Farum, Denmark) was employed as the light source. The acquisition system consists of two photodetectors (PDs; GT322D, Go4fiber Ltd., Hong Kong, China), two transimpedance amplifiers (TIAs; TLV3541, Texas Instruments, Dallas, USA), a microcontroller unit (MCU; Kinetis K25Z, NXP Semiconductors, Eindhoven, the Netherlands), and a computer. An optical circulator (OC) is employed to connect the reflected optical power to one PD, whereas the other PD is directly connected at the optical fiber to acquire the transmitted optical power. Each PD is coupled to the TIAs and the signal acquisition is performed by the microcontroller and transmitted to the computer for data processing.
The fiber used in this setup is a DNP-doped fiber, which is fabricated following the guidelines presented in Ref. [35]. The standard solution doping technique is used to incorporate Mg ions, which trigger the formation of Mg-silicate nanoparticles during the modified chemical vapor deposition (MCVD) process, and Er ions, which are mainly located in the nanoparticles. In addition, germanium (1.85%, molar fraction) and small amounts of phosphorus (0.8%, molar fraction) were added to raise the core refractive index and ease the fabrication of these fibers. It is important to mention that no particle bigger than 100 nm was observed in this fiber.
A. System Characterization
Two experimental protocols were performed to characterize the system under multiple simultaneous disturbances. These protocols are performed to evaluate the transmitted and reflected optical power when disturbances are applied simultaneously on different points along the 150 cm long fiber. Protocol 1 consists of different combinations of disturbances using the same force, including single and multiple simultaneous perturbations. Six points are defined, separated by 15 cm. The goal of this characterization is to identify the disturbance points (when the same force is applied) by analyzing the transmitted and reflected optical powers. Protocol 2 consists of different combinations of multiple disturbances using different forces and the same points of Protocol 1. Figure 2 presents the experimental setup of the characterization.
![]()
Figure 2.Experimental setup of the multiple simultaneous disturbances characterization for two protocols.
Since new data do not depend on past elements in this application, the selected machine learning algorithm was the feed-forward neural network (FFNN), which is generalized and simple to train with full connectivity between adjacent layers. Two FFNN models were designed, as shown in Fig. 3, by analyzing the transmitted and reflected powers (input): one to classify the disturbance event at six predefined points and the other to model a force regression for each predefined point, which can identify which point was disturbed and which force was applied on each point.
![]()
Figure 3.FFNN model for both protocols of system’s characterization.
Two hidden layers, hidden layer 1 and hidden layer 2, were included with, respectively, 600 and 300 neurons after empirical validation. The activation function used in the hidden layers was the rectified linear activation function (ReLU), whereas the activation function used in the output layer is the sigmoid for Protocol 1, since it is a multilabel classification, and linear for Protocol 2. The data is divided into training (80%) and testing (20%), and randomly permuted. Also, the input data (transmitted and reflected powers) are normalized between
The disturbances combination of Protocol 1 is presented in Table 1, where 1 represents a disturbance at the respective point (
Combination of the Multiple Simultaneous Disturbances in Protocol 1 (Disturbance Classification)
| Combination | P1 | P2 | P3 | P4 | P5 | P6 |
|---|---|---|---|---|---|---|
| 1 | 0 | 0 | 0 | 0 | 0 | |
| 0 | 1 | 0 | 0 | 0 | 0 | |
| 0 | 0 | 1 | 0 | 0 | 0 | |
| 0 | 0 | 0 | 1 | 0 | 0 | |
| 0 | 0 | 0 | 0 | 1 | 0 | |
| 0 | 0 | 0 | 0 | 0 | 1 | |
| 1 | 1 | 0 | 0 | 0 | 0 | |
| 1 | 0 | 1 | 0 | 0 | 0 | |
| 1 | 0 | 0 | 1 | 0 | 0 | |
| 1 | 0 | 0 | 0 | 1 | 0 | |
| 1 | 0 | 0 | 0 | 0 | 1 | |
| 0 | 1 | 1 | 0 | 0 | 0 | |
| 0 | 1 | 0 | 1 | 0 | 0 | |
| 0 | 1 | 0 | 0 | 1 | 0 | |
| 0 | 1 | 0 | 0 | 0 | 1 | |
| 0 | 0 | 1 | 1 | 0 | 0 | |
| 0 | 0 | 1 | 0 | 1 | 0 | |
| 0 | 0 | 1 | 0 | 0 | 1 | |
| 0 | 0 | 0 | 1 | 1 | 0 | |
| 0 | 0 | 0 | 1 | 0 | 1 | |
| 0 | 0 | 0 | 0 | 1 | 1 | |
| 1 | 1 | 1 | 0 | 0 | 0 | |
| 0 | 1 | 1 | 1 | 0 | 0 | |
| 0 | 0 | 1 | 1 | 1 | 0 | |
| 0 | 0 | 0 | 1 | 1 | 1 |
Combination of Different and Simultaneous Weights in Protocol 2 (Force Regression in Newtons)
| Combination | P1 | P2 | P3 | P4 | P5 | P6 |
|---|---|---|---|---|---|---|
| 10 | 0 | 0 | 0 | 0 | 0 | |
| 20 | 0 | 0 | 0 | 0 | 0 | |
| 0 | 10 | 0 | 0 | 0 | 0 | |
| 0 | 20 | 0 | 0 | 0 | 0 | |
| 0 | 0 | 10 | 0 | 0 | 0 | |
| 0 | 0 | 20 | 0 | 0 | 0 | |
| 0 | 0 | 0 | 10 | 0 | 0 | |
| 0 | 0 | 0 | 20 | 0 | 0 | |
| 0 | 0 | 0 | 0 | 10 | 0 | |
| 0 | 0 | 0 | 0 | 20 | 0 | |
| 10 | 0 | 10 | 0 | 0 | 0 | |
| 10 | 0 | 20 | 0 | 0 | 0 | |
| 10 | 0 | 30 | 0 | 0 | 0 | |
| 10 | 0 | 0 | 0 | 10 | 0 | |
| 10 | 0 | 0 | 0 | 20 | 0 | |
| 10 | 0 | 0 | 0 | 30 | 0 | |
| 20 | 0 | 10 | 0 | 0 | 0 | |
| 30 | 0 | 10 | 0 | 0 | 0 | |
| 0 | 0 | 10 | 0 | 10 | 0 | |
| 0 | 0 | 10 | 0 | 20 | 0 | |
| 0 | 0 | 10 | 0 | 30 | 0 |
B. Smart Environment Based on the Proposed System
A
![]()
Figure 4.Smart environment protocol. (a) Smart environment setup: entrance carpet (L1), chair (L2), bathroom handrail (L3), bedroom carpet (L4), bed (L5), and desktop (L6). (b) FFNN model for the smart environment protocol.
For the smart environment protocol, an FFNN classification model is also designed to identify the places in the house the person (or persons) accessed using the transmitted and reflected optical powers as the input data, as previously shown. The data are divided into training (80%) and testing (20%), and are associated with their respective classes (places). The input data are normalized between
3. RESULTS AND DISCUSSION
A. System Characterization
The normalized transmitted and reflected optical powers are the input 1 and input 2 of the FFNN model, as shown in Fig. 3, which pass through two hidden layers and then result in the outputs; i.e., the disturbance classification (Protocol 1) or the force regression (Protocol 2) among the six possible positions. These approaches (both protocols) address a critical drawback in TRA-based systems; i.e., the issue of assessing simultaneous perturbations along the fiber. Conventionally, TRA-based systems use the transmission and reflection data to estimate the position of a mechanical perturbation in the fiber, and the use of this approach in conjunction with machine learning enables the detection of multiple perturbations (up to three simultaneous perturbations, in this case) along the optical fiber. Furthermore, the spatial resolution of 15 cm is obtained, which is the distance between two consecutive classification regions and it comprises a length smaller than the length of a human foot. Figure 5 shows the transmission and reflection optical powers for three cases during Protocol 1 (using the same force): single-point perturbation, two-point perturbation, and three-point perturbation.
![]()
Figure 5.Transmitted and reflected optical powers under three conditions in Protocol 1: (a) single-point perturbation, (b) two-point perturbation, and (c) three-point perturbation.
In Protocol 1, the results in Fig. 5 show that both the reflected and transmitted optical powers varied with the position and number of perturbations along the fiber. Thus, the use of the FFNN classification model enables the correct classification of each perturbation, even when multiple perturbations are applied in the DNP-doped optical fiber. Results of the FFNN classification model showed that the accuracy value converged to 99.43% and the loss (MSE) value to 0.0144 for 40 epochs. Such results indicate the suitability of the proposed approach for multiple impact classification, in which the high accuracy indicates negligible errors in the perturbation detection. To verify the classification at each position, Fig. 6 shows the confusion matrices (for each label/position) for single and multiple perturbation detection using deep learning/TRA-based systems. At each position, the classification was approximately 99% or more, in which the positions P2, P4, and P6 presented 100% accuracy. The misclassified samples may be related to mechanical deviations during the Protocol 1 experiment.
![]()
Figure 6.Confusion matrices of each label for single and multiple perturbation detection using the FFNN model.
In Protocol 2, results of the FFNN regression model metrics showed that the RMSE value converged to
![]()
Figure 7.Results of the force regression for each point (no weight was applied on P6).
The results showed a coefficient of determination (
Finally, Fig. 8 presents the temporal analysis of the forces applied on each position during Protocol 2. The continuous line represents the real force, whereas the dotted line represents the force predicted by the regression model. It is possible to observe a similarity between the curves. P1 presents a prediction curve similar to the real one during almost the entire test. However, when a force of
![]()
Figure 8.Temporal analysis of real and predicted forces applied on each position.
B. Smart Environment Based on the Proposed System
Figure 9 presents the results of the transmitted and reflected optical powers during the smart environment protocol. The data are normalized by the results of the unstrained fiber. It is possible to identify the events in which the volunteer accesses the locations ordered in Fig. 4, which was previously presented in Section 2.B. The first location (L1, entrance carpet) is the nearest point to the reflection photodetector, whereas the last location (L6, desktop) is the farthest one. It leads to a higher reflected optical power variation for locations closer to this photodetector, as presented in Fig. 9. Thus, if the force is applied close to the location L1, for example, there will be a variation similar to the one obtained at around 1000 samples (as presented in the bottom graph of Fig. 9), since the reflected optical power is proportional to the perturbation location, which is used as the main mechanism for perturbation location detection. For this reason, if the perturbation location is set as a constant distance to the reflection photodetector, the normalized reflected optical power will present the same variation due to the sensor’s repeatability.
![]()
Figure 9.Results of transmitted and reflected optical power using the TRA setup for place identification in the smart environment.
The transmitted optical power is related to the force applied on the optical fiber, whereas the reflected optical power is related to the location of this force. The disturbance points of each place require different forces; i.e., on the carpets, the force applied on the fiber is proportional to the volunteer’s weight, whereas, on the bathroom handrail, the force can vary with a user’s need to control his/her balance. For this reason, the transmitted optical power variation does not present a pattern. On the other hand, the reflected optical power variation decreases as the distance from the reflection photodetector increases. This is because the fiber length is longer, which leads to a weaker reflected signal than when using shorter fiber lengths. Thus, there is a higher reflected optical power variation in location L1, since it is closer to the reflection photodetector than location L6. It is worth emphasizing that the reflection optical power variation decreases as a function of the distance between the mechanical perturbation point and the reflection photodetector.
The results of the FFNN model are presented in Fig. 10. The accuracy and the loss converged, respectively, to approximately 100% and 0.01. The convergence of the model to an accuracy of 100% represents the ability to identify the places that the person (or two persons) accessed. This identification can be processed online, and it allows remote monitoring by clinicians located in hospitals with high accuracy.
![]()
Figure 10.Metrics of the FFNN model with 70 epochs for the identification of the accessed places in the smart environment: (a) loss and (b) accuracy.
Based on the results of the classification metrics, the FFNN model can be used as the classifier of new data and can help identify the places accessed. Figure 11 presents an example of the result of the new data classification using the designed FFNN model. The input data are normalized between
![]()
Figure 11.Results of the classification of new data using the designed FFNN model for three different conditions: (a) two persons at home, (b) one person at home, and (c) no person at home.
Different results were achieved using other machine learning algorithms to classify events in distributed sensing. Table 3 presents the comparison between different outcomes of researchers in the literature. It is important to notice that the OFS techniques mentioned in Table 3 are distributed sensing approaches, whereas TRA is a single-event technique. Thus, the results achieved in this paper enable the application of low-cost TRA-based sensors to detect multiple and simultaneous events as an alternative to high-cost distributed sensing approaches.
Comparison of Outcomes Using Different Machine Learning Algorithms to Classify Events in Distributed Sensing
| Ref. | Algorithm | OFS | Accuracy |
|---|---|---|---|
| [ | ANN | OFDR | 94.00% |
| [ | SVM | 94.17% | |
| [ | CNN | 96.67% | |
| [ | CNN-LSTM | MZI | 97.00% |
| This paper | FFNN | TRA | 99.43% |
4. CONCLUSION
This study presents the development and performance analysis of a low-cost multiple disturbance tracking system based on the combination of DNP-doped fiber, the TRA technique, and AI algorithms. A machine-learning-based analysis of multiple simultaneous disturbances applied on a TRA-based distributed sensor using a DNP-doped fiber was performed to address one of the major problems in the TRA-based approach; i.e., the ability to detect simultaneous perturbations along the optical fiber. The results showed an accuracy of 99.43% in the detection of single-point, two-point, and three-point perturbations (using the same force), which demonstrate the ability to identify the location of multiple simultaneous disturbances. The results of experiments using different forces during two-point perturbation also presented an RMSE of
Acknowledgment
Acknowledgment. The authors acknowledge S. Trzesien and M. Ude (INPHYNI, Nice, France) for the fabrication of the fiber sample. Carlos Marques acknowledges the FCT.
References
[3] S. R. Teli, S. Zvanovec, Z. Ghassemlooy. Optical Internet of Things within 5G: applications and challenges. 2018 IEEE International Conference on Internet of Things and Intelligence System (IOTAIS), 40-45(2018).
[9] C. L. Campbell, C. Besselli. Impacting healthcare outcomes: connecting digital health within the veteran’s health administration home-based primary care (HBPC) program. Three Facets of Public Health and Paths to Improvements, 95-126(2020).
[12] R. Won. Intelligent learning with light. Nat. Photonics, 12, 570-571(2018).
[13] K. Peters. Polymer optical fiber sensors—a review. Smart Mater. Struct., 20, 013002(2011).
[14] A. Leal-Junior, A. Frizera-Neto. Optical Fiber Sensors for the Next Generation of Rehabilitation Robotics(2022).
[16] S. Li, L. D. Xu, S. Zhao. 5G Internet of Things: a survey. J. Ind. Inf. Integr., 10, 1-9(2018).
[20] G. Rajan. Optical Fiber Sensors: Advanced Techniques & Applications(2015).


Set citation alerts for the article
Please enter your email address

© Copyright 2018-2021 | Chinese Laser Press. All Rights Reserved 沪ICP备15018463号-20