• Matter and Radiation at Extremes
  • Vol. 5, Issue 3, 035201 (2020)
Feng Wang1、*, Shaoen Jiang1, Yongkun Ding2, Shenye Liu1, Jiamin Yang1, Sanwei Li1, Tianxuan Huang1, Zhurong Cao1, Zhenghua Yang1, Xin Hu1, Wenyong Miao1, Jiyan Zhang1, Zhebin Wang1, Guohong Yang1, Rongqing Yi1, Qi Tang1, Longyu Kuang1, Zhichao Li1, Dong Yang1, Yulong Li1, Xiaoshi Peng1, Kuan Ren1, and Baohan Zhang1
Author Affiliations
  • 1Laser Fusion Research Center, China Academy of Engineering Physics, Mianyang, China
  • 2Institute of Applied Physics and Computational Mathematics, China Academy of Engineering Physics, Beijing, China
  • show less
    DOI: 10.1063/1.5129726 Cite this Article
    Feng Wang, Shaoen Jiang, Yongkun Ding, Shenye Liu, Jiamin Yang, Sanwei Li, Tianxuan Huang, Zhurong Cao, Zhenghua Yang, Xin Hu, Wenyong Miao, Jiyan Zhang, Zhebin Wang, Guohong Yang, Rongqing Yi, Qi Tang, Longyu Kuang, Zhichao Li, Dong Yang, Yulong Li, Xiaoshi Peng, Kuan Ren, Baohan Zhang. Recent diagnostic developments at the 100 kJ-level laser facility in China[J]. Matter and Radiation at Extremes, 2020, 5(3): 035201 Copy Citation Text show less
    Schematic of the more than 80 diagnostics installed at the 100 kJ-level laser facility.
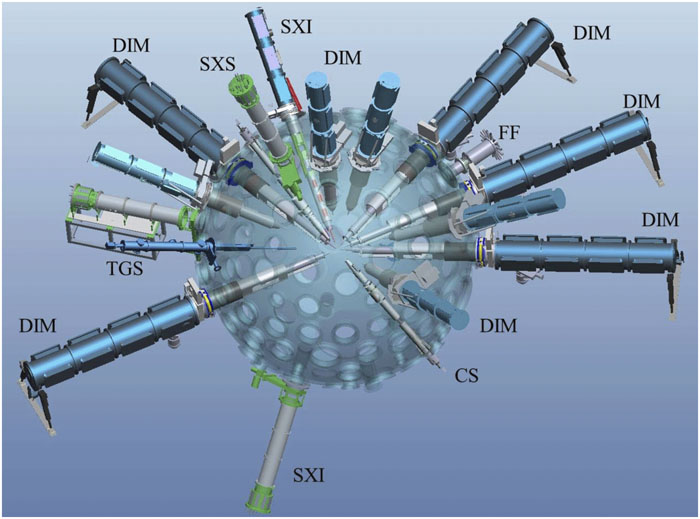
    Fig. 1. Schematic of the more than 80 diagnostics installed at the 100 kJ-level laser facility.
    Schematic of the laser beam transmission system.
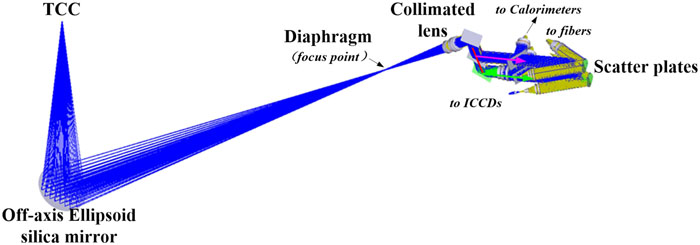
    Fig. 2. Schematic of the laser beam transmission system.
    Schematic of the PSBO system.
    Fig. 3. Schematic of the PSBO system.
    Self-emitting images of two-step samples recorded by a streak camera: 70–80 μm-thick steps.
    Fig. 4. Self-emitting images of two-step samples recorded by a streak camera: 70–80 μm-thick steps.
    Spectral responses of each channel of the FFS.
    Fig. 5. Spectral responses of each channel of the FFS.
    Picture of the FFS at the laser facility.
    Fig. 6. Picture of the FFS at the laser facility.
    Typical hard x-ray spectra measured in hohlraum energetics experiments.
    Fig. 7. Typical hard x-ray spectra measured in hohlraum energetics experiments.
    Geometry of the gated detector.
    Fig. 8. Geometry of the gated detector.
    X-ray framing camera system developed for the 100 kJ-level laser facility.
    Fig. 9. X-ray framing camera system developed for the 100 kJ-level laser facility.
    Deformation of the capsule as it implodes under compression, recorded by the XFC combined with pinhole array imaging.
    Fig. 10. Deformation of the capsule as it implodes under compression, recorded by the XFC combined with pinhole array imaging.
    Temporal and spatial evolution of the rapidly expanding initial perturbation of a sample recorded by the XFC combined with the pinhole array.
    Fig. 11. Temporal and spatial evolution of the rapidly expanding initial perturbation of a sample recorded by the XFC combined with the pinhole array.
    Setup of the MBIS (left) and a monochromatic implosion trajectory measured experimentally by the MBIS (right).
    Fig. 12. Setup of the MBIS (left) and a monochromatic implosion trajectory measured experimentally by the MBIS (right).
    Monochromatic implosion trajectory measured experimentally by the MBIS.
    Fig. 13. Monochromatic implosion trajectory measured experimentally by the MBIS.
    Principle of penumbral imaging with a bicone.
    Fig. 14. Principle of penumbral imaging with a bicone.
    X-ray backlit image of a tungsten cylinder obtained by the liquid scintillator array detector.
    Fig. 15. X-ray backlit image of a tungsten cylinder obtained by the liquid scintillator array detector.
    3D representation of a yield detector.
    Fig. 16. 3D representation of a yield detector.
    Comparison of neutron yield measured by the NTOF spectrometer and by In activation.
    Fig. 17. Comparison of neutron yield measured by the NTOF spectrometer and by In activation.
    3D representation of a DT ion temperature detector.
    Fig. 18. 3D representation of a DT ion temperature detector.
    Typical neutron time spectrum from a DD implosion.
    Fig. 19. Typical neutron time spectrum from a DD implosion.
    3D representation of the neutron bang time detector.
    Fig. 20. 3D representation of the neutron bang time detector.
    (a) Typical scope trace of the neutron bang time in a DD implosion. (b) Simulated signals produced by neutron time spectra with the same peak time but different widths.
    Fig. 21. (a) Typical scope trace of the neutron bang time in a DD implosion. (b) Simulated signals produced by neutron time spectra with the same peak time but different widths.
    Comparison of neutron bang times obtained from NTOF and from NTD.
    Fig. 22. Comparison of neutron bang times obtained from NTOF and from NTD.
    DiagnosticNumberPurpose and function
    X-ray framing camera (XFC)3Images x rays with a temporal resolution of 50 ps and a spatial resolution of 15 µm
    X-ray streak camera3Diagnoses x-ray emission from targets with time resolution and is used to synchronize the arrival time of the laser on the target: 30 mm, 5 ps, 15 line pairs/mm, 500:1
    Flat-response x-ray detector (FXRD) and M-band FXRD20Measures x-ray flux: 0.1–4 keV (FXRD) or 1.6–4.4 keV (MXRD)
    Line-image velocity interferometer system for any reflector (VISAR)1Measures shock velocity history with time and spatial resolution: 5 µm, 5 ps, 1.12–17.2 km/s per fringe
    Kirkpatrick–Baez (KB)/KB-amélioré (KBA) microscope1Provides images of x-ray emission and is used to survey the cavity and pointing of eight laser channels: x-ray energy 8 keV; spatial resolution 3 µm at center and 5 µm at edge
    Full-aperture backscatter8Measures light scattered into the lens focus in the spectral region 340–800 nm with energy uncertainty <20%
    Near backscatter8Measures side-scattered light in the spectral region 340–800 nm with energy uncertainty <20%
    Crystal spectrometer2Measures 2–10 keV x-ray spectrum
    Neutron time-of-flight (NTOF) spectrometer2Diagnoses ion temperature in fuel
    RABIT system1Detector size for decay time Φ60 × 30 mm (sliced); yield range 108–1014
    Table 1. List of some of the significant diagnostics for ICF at the 100 kJ-level laser facility.
    ParameterValue
    Spectral measurement range of straight-passing and forward SBS light340–360 nm
    Spectral measurement range of forward SRS light400–700 nm
    Energy measurement range of straight-passing and forward SBS light≤2400 J
    Energy measurement range of forward SRS light≤300 J
    Uncertainty in energy measurement≤20% (k = 1)
    Table 2. Main technical parameters of the TBD system.
    FunctionNumberDetector size, decay timePMT gain, FWHMYield range
    YieldDD or DT neutron3Φ60 × 30 mm (sliced into 8 cuts), 10 ns103–107, 2 ns107–1013
    DD secondary neutron1Φ180 × 100 mm, 15 ns104–106, 5 ns106–108
    Ion temperatureDD neutron spectrum3Φ50 × 20 mm, 0.7 ns104–106, 1.1 ns109–1011
    DT neutron spectrum3Φ40 ×1 0 mm, 0.7 ns104–106, 0.3 ns1010–1013
    Neutron bang time1Φ10 × 1 mm, 1.6 ns104–106, 0.3 ns108–1013
    Table 3. Main parameters of the NTOF at the 100 kJ-level laser facility.
    Feng Wang, Shaoen Jiang, Yongkun Ding, Shenye Liu, Jiamin Yang, Sanwei Li, Tianxuan Huang, Zhurong Cao, Zhenghua Yang, Xin Hu, Wenyong Miao, Jiyan Zhang, Zhebin Wang, Guohong Yang, Rongqing Yi, Qi Tang, Longyu Kuang, Zhichao Li, Dong Yang, Yulong Li, Xiaoshi Peng, Kuan Ren, Baohan Zhang. Recent diagnostic developments at the 100 kJ-level laser facility in China[J]. Matter and Radiation at Extremes, 2020, 5(3): 035201
    Download Citation