Abstract
A 100 kJ-level laser facility has been designed to study inertial confinement fusion physics in China. This facility incorporates various diagnostic techniques, including optical, x-ray imaging, x-ray spectrum, and fusion product diagnostics, as well as general diagnostics assistance systems and central control and data acquisition systems. This paper describes recent developments in diagnostics at the facility.
I. INTRODUCTION
Inertial confinement fusion (ICF) relies on the inertia of the fuel mass to provide confinement. Approaches such as direct drive, indirect drive (ID), shock ignition, and fast ignition are typically employed.1–6 The ID approach has attracted particular interest owing to its relaxed requirements regarding laser beam uniformity and its reduced sensitivity to hydrodynamic instabilities compared with other approaches.1 Furthermore, the ID approach offers better symmetry characteristics, owing to the fact that the x-ray radiation is confined within a cavity and interacts continuously with the cavity wall. Multiple absorption and reemission processes then cause isotropization of the radiation field and reduce temperature variations on the cavity wall.7 The laser energy can thus be effectively absorbed and converted into soft x rays, which can then be transformed into intense, near-Planckian radiation light. This near-Planckian incoherent radiation is then used to irradiate the fuel capsule inside the cavity. Therefore, both the x-ray radiation and the wall temperature in the cavity play important roles in ID ICF.8
The advantages of ID ICF have motivated studies of its implementation at existing and planned ICF laser facilities, including the NIF in the USA,1 Laser MegaJoule (LMJ) in Europe,3 and the Shen Guang II and III prototypes in China.4 The 100 kJ-level laser facility in China has been used for ID experiments since 2012. This facility has a 180 kJ laser that is used to demonstrate ignition physics in inertially confined plasmas. Specifically, it is used to irradiate a hohlraum that has the form of a right circular cylinder in four cones of beams with separately shaped pulses delivered to the outer and inner cones. This facilitates control of the time-dependent drive asymmetry and keeps the centroid of the x-ray emission fixed in space as the plasma moves in the hohlraum. The performance of the compressed target can be described in terms of hotspot, cold shell, and fuel characteristics.1 The key hotspot characteristics include neutron yield, temperature, and burn history; spot size, shape, and areal density; and the mix of shell and fuel in the spot. The key characteristics of the compressed fuel and remaining ablator are the value and isotropy of its areal density.
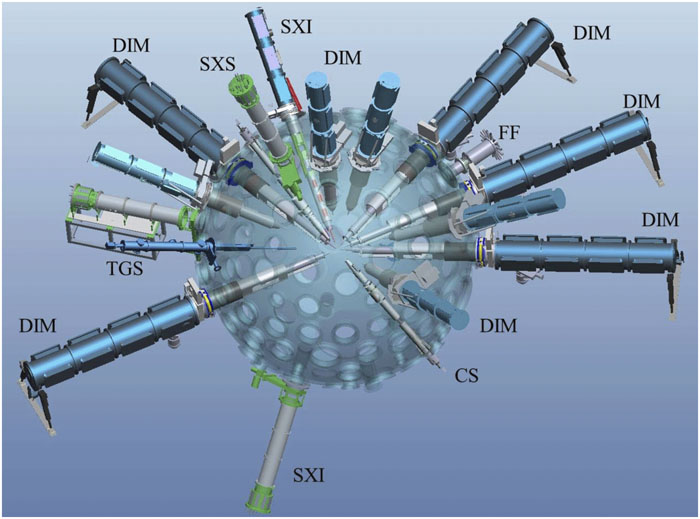
In a previous review, it was reported that over 80 diagnostics had been installed at the 100 kJ-level laser facility, as shown in Fig. 1 and Table I. These include optical, x-ray imaging, x-ray spectrum, and fusion product diagnostics, together with general diagnostic and recording systems.9 Recent developments in the optical, x-ray, and nuclear diagnostic techniques at the facility are described in the present paper.

Figure 1.Schematic of the more than 80 diagnostics installed at the 100 kJ-level laser facility.
| Diagnostic | Number | Purpose and function |
|---|
| X-ray framing camera (XFC) | 3 | Images x rays with a temporal resolution of 50 ps and a spatial resolution of 15 µm |
| X-ray streak camera | 3 | Diagnoses x-ray emission from targets with time resolution and is used to synchronize the arrival time of the laser on the target: 30 mm, 5 ps, 15 line pairs/mm, 500:1 |
| Flat-response x-ray detector (FXRD) and M-band FXRD | 20 | Measures x-ray flux: 0.1–4 keV (FXRD) or 1.6–4.4 keV (MXRD) |
| Line-image velocity interferometer system for any reflector (VISAR) | 1 | Measures shock velocity history with time and spatial resolution: 5 µm, 5 ps, 1.12–17.2 km/s per fringe |
| Kirkpatrick–Baez (KB)/KB-amélioré (KBA) microscope | 1 | Provides images of x-ray emission and is used to survey the cavity and pointing of eight laser channels: x-ray energy 8 keV; spatial resolution 3 µm at center and 5 µm at edge |
| Full-aperture backscatter | 8 | Measures light scattered into the lens focus in the spectral region 340–800 nm with energy uncertainty <20% |
| Near backscatter | 8 | Measures side-scattered light in the spectral region 340–800 nm with energy uncertainty <20% |
| Crystal spectrometer | 2 | Measures 2–10 keV x-ray spectrum |
| Neutron time-of-flight (NTOF) spectrometer | 2 | Diagnoses ion temperature in fuel |
| RABIT system | 1 | Detector size for decay time Φ60 × 30 mm (sliced); yield range 108–1014 |
Table 1. List of some of the significant diagnostics for ICF at the 100 kJ-level laser facility.
II. OPTICAL DIAGNOSTICS
A. Laser beam transmission system
The transmitted beam diagnostic (TBD) system can obtain important information on laser–plasma instability (LPI), such as laser beam transmission, beam filamentation, and beam spray. The investigation of laser beam transmission through large-scale-length plasmas is crucial for ID ICF experiments. Beam deflection and spray due to self-focusing and filamentation as well as beam absorption by parametric instabilities alter the beam intensity distribution at the fusion target and can have important effects on capsule symmetry.9–12 A transmitted-beam diagnostic system has been developed for the high-intensity, frequency-tripled (3ω) interaction laser beam passing through fusion-relevant plasmas in the target chamber center (TCC), as shown in Fig. 2. A 400 mm-diameter off-axis ellipsoid bare-surface mirror is placed 2.35 m from the TCC in the beam path of the interaction beam to reflect 4% of the transmitted light to the detector assembly outside the target chamber. The light is collected and reflected from one focus point located at the TCC to another focus point in the diaphragm. Several lenses and filters in the assembly collimate and focus the light into several types of detectors, such as an energy calorimeter and a fiber-based spectrometer for measuring the energy and time-resolved spectrum, respectively. An imaging lens images the TBD collection mirror plane onto a Lambertian diffuser plate, and then an imaging charge-coupled device (CCD) records the spatial distribution of the transmitted light collected by the mirror.
Figure 2.Schematic of the laser beam transmission system.
Taking account of the spatial distribution and energy of the 3ω laser beam, the small irradiating angle of the laser beam, and the scattering of the light [given that the energy of the laser beam is 3000 J/3 ns or 1000 J/1 ns, the straight-passing and forward stimulated Brillouin scattered (SBS) light is estimated to constitute 30%–80% of the total energy, while the highest energy of the forward stimulated Raman scattered (SRS) light constitutes nearly 10% of the total energy], the system is designed with the technical parameters shown in Table II.
| Parameter | Value |
|---|
| Spectral measurement range of straight-passing and forward SBS light | 340–360 nm |
| Spectral measurement range of forward SRS light | 400–700 nm |
| Energy measurement range of straight-passing and forward SBS light | ≤2400 J |
| Energy measurement range of forward SRS light | ≤300 J |
| Uncertainty in energy measurement | ≤20% (k = 1) |
Table 2. Main technical parameters of the TBD system.
B. Passive shock breakout (PSBO) system
Equations of state of materials at high pressure and temperature are important in astrophysics, ICF, and fundamental material studies.13,14 Shock waves are routinely used to compress and heat materials under these conditions, and high-power lasers are being increasingly used as drivers for these experiments. We report here on one such passive shock breakout (PSBO) system, shown in Fig. 3, which measures the shock-induced luminescence at the rear of thin metal foils of varying thickness. The diagnostic system is used to accurately measure the shock transit time by recording optical shadowgrams at various instants of time and subsequently identifying the instants at which the foils are just set into motion. The shock transit times measured in foils of different thickness can give the value of the shock velocity at a given laser intensity. The target motion recorded by a shadowgraph can also give the target velocity, from which the shock pressure can be estimated. PSBO systems are widely used and have provided much experimental data in investigations of the equations of state of materials at high pressure, in temperature measurements through shock waves, in studies of preheating by shock waves, in investigations of material properties, and in laboratory astrophysics.15–17
Figure 3.Schematic of the PSBO system.
A neodymium-doped phosphate glass system that operates with frequency-tripled 0.35 µm light is used to generate the shock pressures explored in the experiments, and eight laser beams with energies of 7200 J are delivered in 1 ns square pulses. Based on the shock wave images and the curve of the thickness profile of a step sample, we can calculate the shock wave velocities of the sample, as shown in Fig. 4. The average shock wave velocities are 34.30 km/s in a 80.90 µm Al step and 23.78 km/s in a 73.20 µm Cu step.
Figure 4.Self-emitting images of two-step samples recorded by a streak camera: 70–80 μm-thick steps.
III. X-RAY DIAGNOSTICS
A. Filter-fluorescence spectrometer (FFS)
Hot electrons generated by LPI may preheat the cryogenic deuterium–tritium fuel of the capsule and provide earlier driven asymmetry.18–20 Filter-fluorescence diagnostics is the most common way to quantify the number of hot electrons by measuring the absolute hard x-ray spectra generated though energy deposition by hot electrons. The filter-fluorescence spectrometer (FFS) consists of 10 channels (originally 15), which can be configured to measure x rays at various energies with a narrow bandpass (see Fig. 5), and it has been in operation since the opening of the laser facility in 2015. Each channel is composed of a prefilter, a fluorescer foil, and a postfilter. The fluorescer signal is converted to visible light by a NaI scintillator and detected by a photomultiplier tube (PMT). All of these components are absolutely calibrated in the hard x-ray laboratory using both a Hanke-type hard x-ray source and a 241Am radioactive source.
Figure 5.Spectral responses of each channel of the FFS.
The mechanical parts of the FFS were recently modified to improve shielding from the scattering background. As well as the reduction in the number of channels from 15 to 10, the scintillators in four channels were changed to BaF2 to improve the temporal resolution. In this way, the neutron background can now be distinguished from the hard x-ray signals of interest. A photograph of the FFS is shown in Fig. 6.
Figure 6.Picture of the FFS at the laser facility.
In most experiments, eight channels are used to cover the photon energy range from 10 keV to 100 keV by different combinations of filters and fluorescers, with the aim of focusing on the hot electron component attributed to SRS. The FFS is a conventional diagnostic tool for hohlraum energetics experiments. The hot electron fractions have been measured to provide a comparison between the vacuum hohlraum and the gas-filled hohlraum for different hohlraum designs and laser conditions (Fig. 7). In addition to normal inspection of hard x-ray spectra, the FFS is also used in the study of a variety of novel ignition approaches by expanding the detected photon energy range to 200 keV.
Figure 7.Typical hard x-ray spectra measured in hohlraum energetics experiments.
B. x-ray framing camera (XFC)
The x-ray framing camera (XFC) combined with an x-ray pinhole array or micro-imaging system can record two-dimensional x-ray images at different times. Depending on the experimental diagnostic requirements, the detection targets of the XFC can be projected images of self-emitting x-rays from the goal plasma or perspective images of pars dorsalis x-rays through the goal plasma. XFC is commonly applied to observe the temporal and spatial evolution of small-scale transient high-temperature and high-density plasmas, which is an essential aspect of experimental research in high-energy-density physics (HEDP) and ICF. The XFC system comprises several parts, among which the detector part is the most important. This consists of a gated detector and a CCD readout system. The gated detector is a two-dimensional x-ray imager composed of a phosphor screen and a pulse-biased microchannel plate (MCP) coated with four metal strips. The working principle of the gated x-ray imager has been described in several publications.21–23 Sequential images are obtained by applying ultrafast gate signals to the metal strips, which also act as the x-ray cathode. In addition, a square-wave voltage signal is required to generate an acceleration field in the gap (∼500 µm) between the output face of the MCP and the phosphor screen. The CCD readout system is a scientific-grade camera with a back-illuminated 4100 × 4100 array of 9-μm-square pixels directly coupled to the phosphor screen. The ICF experiments in the 100 kJ-level laser facility require that the gated detector has a spatial resolution better than 30 µm and a temporal resolution better than 70 ps. The temporal resolution is limited mainly by the duration time of the gate signal and the mean transit time of the secondary electron cloud in the channel of the MCP. To ensure the required gain, the duration of the gate signal must not be less than the mean transit time of the secondary electrons, which is approximately 200 ps for the MCP utilized in this detector. The geometry of the gated detector is shown in Fig. 8.
Figure 8.Geometry of the gated detector.
The general structure of the XFC system that we have developed for the 100 kJ-level laser facility is shown in Fig. 9. The XFC system is required to image different objects that may have quite different dimensions. The dimension of the compressed capsule is approximately 30–40 µm; however, when the XFC is used to investigate the evolution of plasma in the hohlraum, the object may have a dimension of several millimeters. Therefore, variable magnification is required in the design of the pinhole imaging system. The multipinhole imaging system that we have designed contains a conical sleeve with a retractable nose. The pinhole array is positioned at the front side of the retractable nose, and the magnification of the system can be easily adjusted as needed. All the electronic modules of the system are integrated in a rectangular air box of overall length 1 m. The overall length of the XFC system is approximately 2.7 m.
Figure 9.X-ray framing camera system developed for the 100 kJ-level laser facility.
To control the radiation drive symmetry, based on the images of the capsule implosion asymmetry (Fig. 10) and the extracted P2 asymmetry component, we can change the radiation field distribution in the hohlraum by adjusting the power ratio of the inner and outer laser rings. It is thus possible to reduce the capsule radiation drive asymmetry and obtain a nearly symmetric spherical implosion under compression.
Figure 10.Deformation of the capsule as it implodes under compression, recorded by the XFC combined with pinhole array imaging.
As shown in Fig. 11, in Rayleigh–Taylor experiments, the XFC combined with the pinhole array can be used to record the temporal and spatial evolution of the rapidly expanding initial perturbation of a sample under the influence of fluid-dynamical instability. With the use of backlighting to produce transmitted two-dimensional images at different times, data on the time-varying modulated amplitude of area density perturbations of the sample can be obtained. The growth factor of the fluid-dynamical instability can also be determined.
Figure 11.Temporal and spatial evolution of the rapidly expanding initial perturbation of a sample recorded by the XFC combined with the pinhole array.
The spatial resolution of the camera itself is 20–40 line pairs/mm. Taking account of the magnification factor (5–20) and the spatial resolution of the imaging system, the spatial resolution of the entire detection system is then typically 10–30 µm. The microstrips of the XFC have a gating time width of approximately 70 ps for a traveling wave, leading to a definite kinetic blur effect. Thus, there are corresponding restrictions on the detected objects. In the case of the images in Fig. 11, we must obtain the spatial resolution of the detection system and modulation transfer function data through experimental calibration, because the limits imposed by spatial resolution have a smoothing effect on the images recording the perturbation growth of the sample. Furthermore, the shorter the x-ray wavelength, the more obvious will be the smoothing effect. We are intending to impose a time mark signal on the strip and thereby measure the time mark and the data signal simultaneously. With this design, a timing precision of 20 ps should be achievable.
C. Monochromatic backlight imaging system (MBIS)
The monochromatic backlight imaging system (MBIS) takes backlit transmitted photographs of the target plasma using a spherically bent crystal. Such systems are widely used to measure hydrodynamic instabilities and the hydrodynamic processes involved in capsule implosion and are of great importance for HEDP and ICF experimental research.24,25 The MBIS is based on 2D high-spatial-resolution radiography, which is a setup with nearly normal incidence. The spherically bent crystal is usually set 135 mm away from the sample and gives the magnification of 11.8 in the meridional plane. A quartz 2133 crystal was bent with a radius of 250 mm in our laboratory. The dimension of the crystal was Φ20 mm and its center part with Φ10 mm is usually used to keep the field of view (FOV) larger than 1.3 mm. The Bragg angle was chosen as 83.1°, which matches the 5.205 keV He-like emission of vanadium. The backlighter foil is located 20 mm away from the sample and is usually less than 300 µm in diameter. A smaller backlighter is also used to improve the spatial resolution in 2D. A series of fiducials are mounted on the MBIS to monitor the positions of the backlighter, sample, crystal, and recording system. Any variations of the system larger than 50 µm can be inspected. The spectral resolution and the orientation of the bent crystal were checked with the x-ray source in an x-ray diffraction laboratory, and the system was commissioned in different laser facilities using a mesh sample. A spatial resolution better than 7 µm was achieved over a large region.
In combination with the streak camera, MBIS can record continuously varying spatial distributions (Fig. 12). It has been used for implosion dynamics measurements since 2011. Noise from the diagnostic holes of the hohlraum and the stagnated emission of the compressed capsule are reduced by the high spectral resolution and the setup of the MBIS. The whole trajectory, including the stagnation phase, is obtained owing to the mitigation of the effects of core emission (Fig. 13). The MBIS is an essential diagnostic tool to study the deceleration phase of implosion.
Figure 12.Setup of the MBIS (left) and a monochromatic implosion trajectory measured experimentally by the MBIS (right).
Figure 13.Monochromatic implosion trajectory measured experimentally by the MBIS.
IV. NUCLEAR DIAGNOSTICS
A. Neutron imaging system (NIS)
The neutron imaging system (NIS) can be used to image compressed targets filled with fuel by measuring the neutron emission image.26 The asymmetry of a hotspot can be inferred from the primary neutron image, while the downscattered neutron image provides information about the cold fuel. An NIS based on penumbral imaging is under construction for ICF research. Because the neutron-emitting region of the implosion is very small, only 30–50 µm, implosion neutron imaging can be realized by using a biconical penumbra hole. The spatial distribution of neutron emission can then be obtained via a mathematical model that takes account of the signal-to-noise ratio. If the neutron yield is too low, there are large fluctuations in the signal statistics and the signal-to-noise ratio of the image is poor. Successful measurements require a spatial resolution of 50 µm or less. If the neutron yield of the DT is greater than 1 × 10¹³ and the spatial resolution of the NIS is 20 µm or smaller, then effective data can be provided. A bicone with a 1.16 mm input diameter, a 1.44 mm waist diameter, a 1.64 mm exit diameter, and a length of 6 cm has been designed for this system.27Figure 14 illustrates the principle of penumbral imaging with a bicone. The full width at half maximum (FWHM) of the point spread function is approximately 15 µm. The alignment precision must be better than 60 µm, and the tilt angle must be within 0.35 mrad. The aperture fabrication tolerance must be better than 7 µm, which is necessary for reconstructing neutron images without the aperture introducing measurable features.
Figure 14.Principle of penumbral imaging with a bicone.
Spatial resolution and neutron energy deposition have been investigated by the Monte Carlo method for three kinds of scintillation array detectors: a liquid scintillator array, a plastic scintillator array, and a deuterated liquid scintillator array. The energy deposition in the hydrogen-rich scintillator is greater than that in the deuterated scintillator, and thus the former is preferred for better spatial resolution. A liquid scintillator array with a diameter of 150 mm has been manufactured. The diameter of each fiber is approximately 100 µm and the holes between the fibers are filled with black silk. This scintillator array has been used to obtain an x-ray backlit image of a tungsten cylinder, as shown in Fig. 15. The spatial resolution is about 0.3 mm. In the future, the spatial resolution of neutron images will be measured with a neutron source.
Figure 15.X-ray backlit image of a tungsten cylinder obtained by the liquid scintillator array detector.
B. Neutron time-of-flight (NTOF) spectrometer
The neutron time-of-flight (NTOF) spectrometer is an important diagnostic tool in the 100 kJ-level laser facility and is widely used in implosion experiments.28,29 In implosion experiments, because the arrival times of neutrons with different kinetic energies flying from a target to the detector vary, the distribution of the energy spectrum of a neutron when it begins to leave the target can be inferred from the impulse shape of the neutron flight time recorded by the NTOF. In the hotspot plasma of the implosion core, the greatest contribution to the spread of the neutron energy spectrum is that from ion thermal motion. Thus, after separate suitable analysis models for DD and DT fusion reactions, the ion temperature of the fuel plasma and other related effects can be inferred from the distribution of the neutron energy spectrum. Implosion experiments at the 100 kJ-level laser facility are typically conducted with a fuel ion temperature of 2–3 keV. The NTOF measures neutron yield, ion temperature, and the neutron bang time at stagnation. The NTOF at the 100 kJ facility is based on that at the SG III prototype facility. It has 11 neutron detectors based on plastic scintillators and PMTs. The detectors were designed as three different structures according to their functions. The main parameters of the NTOF are shown in Table III.
| Function | Number | Detector size, decay time | PMT gain, FWHM | Yield range |
|---|
| Yield | DD or DT neutron | 3 | Φ60 × 30 mm (sliced into 8 cuts), 10 ns | 103–107, 2 ns | 107–1013 |
| DD secondary neutron | 1 | Φ180 × 100 mm, 15 ns | 104–106, 5 ns | 106–108 |
| Ion temperature | DD neutron spectrum | 3 | Φ50 × 20 mm, 0.7 ns | 104–106, 1.1 ns | 109–1011 |
| DT neutron spectrum | 3 | Φ40 ×1 0 mm, 0.7 ns | 104–106, 0.3 ns | 1010–1013 |
| Neutron bang time | | 1 | Φ10 × 1 mm, 1.6 ns | 104–106, 0.3 ns | 108–1013 |
Table 3. Main parameters of the NTOF at the 100 kJ-level laser facility.
Four detectors are used to measure neutron yield. One large detector (detector No. 6) is used to measure the secondary neutron yield in DD gas implosions to diagnose the areal density of the hotspot. The other three yield detectors, which cover a wide yield range, are used to measure the primary neutron yield in deuterium (DD) and DT implosions. A 3D representation of one of these detectors is shown in Fig. 16. They use PMTs with a wide linear range, with gain varying from 103 to 107. Each scintillator of the detectors is sliced into eight pieces to allow adjustments to the detection efficiency according to neutron yield. A set of calibrated neutral glass filters is used in front of the PMTs to avoid saturation in high-yield experiments. The NTOF spectrometer can measure neutron yields down to 107 when neutron activation diagnosis is not possible. The spectrometer has a neutron yield accuracy better than 10%. Figure 17 shows the neutron yields acquired by the NTOF spectrometer and by indium activation in the same DD implosion. The standard deviation of the yield is approximately 7.6%.
Figure 16.3D representation of a yield detector.
Figure 17.Comparison of neutron yield measured by the NTOF spectrometer and by In activation.
Six NTOF detectors are used to probe the DT neutron and DD neutron spectra to measure the ion temperature. The DD spectrum detector is designed to be more sensitive, whereas the design of the DT spectrum detector focuses on a fast response. Figure 18 shows the structure of the DT spectrum detector. A DT spectrum detector and a DD spectrum detector are located at the south pole of the chamber, approximately 15 m from the target. Two DD spectrum detectors are located in equatorial orientations, approximately 6–10 m from the target. Two DT spectrum detectors are also located in equatorial orientations, approximately 15 m from the target. The DT spectrum detectors use 10 mm-diameter MCP PMTs, which have a 0.3 ns FWHM temporal response. The DD spectrum detectors use 50 mm-diameter PMTs, which have a 1.1 ns FWHM temporal response. Plastic scintillators with 0.7 ns decay time are used in all the spectrum detectors. A method based on deconvolution is used to reconstruct the neutron spectrum. The accuracy of ion temperature determination is strongly related to statistical fluctuations and can be better than 10% with a sufficient number of neutron hits. Figure 19 shows a typical neutron time spectrum from a DD implosion.
Figure 18.3D representation of a DT ion temperature detector.
Figure 19.Typical neutron time spectrum from a DD implosion.
Figure 20 shows the structure of the bang time detector. A thin piece of scintillator is connected to a 10 mm-diameter MCP-PMT with a 1.5 m-long fiber bundle. The detector is loaded in a tube that is used to position the detector nose at least 10 cm away from the target. The PMT is coated with lead to reduce the x-ray impulse. A set of glass filters is used in front of the PMT to prevent saturation in high-yield experiments. To scale the time interval between the bang time and the starting time of the laser, an x-ray pulse produced from a gold target irradiated by a 200 ps FWHM laser pulse is probed. The transit time spread of the PMT using the bang time detector is about 25 ps. The positioning error of the scintillator is approximately 1 mm. The time accuracy of the bang time detector is better than 40 ps for DT and better than 60 ps for DD. Figure 21(a) shows a scope trace of the neutron bang time for a DD implosion. The peak time of the neutron pulse cannot be determined directly on the trace because the neutron time spectrum is modulated by the detector response. Figure 21(b) shows simulated signals produced by neutron time spectra with the same peak time but different widths. The “75% point” of the rise edge synchronizes well on all signals and is used to calculate the bang time. However, the 75% point only fits the peak time on a symmetric peak. A neutron time spectrum can be more complicated (e.g., a double or asymmetric peak) in some implosions, and the bang time cannot be measured precisely using NTOF in these cases. Neutron temporal diagnostics (NTD) based on a streak camera are used to measure the fusion reaction history. The bang time can be determined from the fusion reaction history curve regardless of the shape of the neutron pulse. Figure 22 shows the bang times obtained from NTOF and from NTD for DD implosions in experiments with six laser entrance holes.
Figure 20.3D representation of the neutron bang time detector.
Figure 21.(a) Typical scope trace of the neutron bang time in a DD implosion. (b) Simulated signals produced by neutron time spectra with the same peak time but different widths.
Figure 22.Comparison of neutron bang times obtained from NTOF and from NTD.
The time resolution of the NTOF detector is 1–3 ns, and the flight distance of the neutron is configured based on the different requirements of DD and DT implosion experiments. Furthermore, the influence of the time spread of the detection system and the measurement uncertainties in the ion temperature are dominated by the signal-to-noise ratio. When the neutron yield is relatively low (e.g., when the DD neutron yield is lower than 1 × 10⁹), the signal-to-noise ratio of the NTOF detector is poor and the measurement uncertainty is greater than 30%. Conversely, for higher neutron yields (e.g., DD neutron yields greater than 1 × 10¹⁰), the signal-to-noise ratio of the NTOF detector is good and the measurement uncertainty is approximately 10%. The time response of this detector system is calibrated by implosion neutrons from a DT-filled capsule, with the thermal broadening of fusion neutrons neglected and the neutron emission time width offset in the unfolding process.30
V. CONCLUSIONS
This paper has described recent developments in diagnostics at the 100 kJ-level laser facility in China. Optical diagnostics such as the TBD and PSBO systems; x-ray diagnostics such as the FFS, XFC, and MBIS; and nuclear diagnostics such as the NIS and the NTOF detectors have been incorporated into the facility. The development of the facility has prompted a number of scientific innovations, and a range of new concepts for diagnostic techniques are currently being explored.
References
[1] O. Landen, J. Lindl, J. Edwards, E. Moses. Review of the National Ignition Campaign 2009–2012. Phys. Plasmas, 21, 020501(2014).
[2] D. T. Casey, O. A. Hurricane, P. M. Celliers, C. Cerjan, D. A. Callahan. Fuel gain exceeding unity in an inertially confined fusion implosion. Nature, 506, 343(2014).
[3] X. Xie, W. Huo, K. Lan, J. Liu, Z. Li. Progress in octahedral spherical hohlraum study. Matter Radiat. Extremes, 1, 8(2016).
[4] V. N. Goncharov, T. C. Sangster, E. M. Campbell, P. B. Radha, S. P. Regan. Laser-direct-drive program: Promise, challenge, and path forward. Matter Radiat. Extremes, 2, 37(2017).
[5] L. Hao, W. L. Shang, K. Woo, S. X. Hu, R. Betti et al. Electron shock ignition of inertial fusion targets. Phys. Rev. Lett., 119, 195001(2017).
[6] W. L. Shang, R. Betti, S. P. Regan, C. Stoeckl, T. C. Sangster et al. Properties of hot-spot emission in a warm plastic-shell implosion on the OMEGA laser system. Phys. Rev. E, 98, 033210(2018).
[7] R. Betti, O. A. Hurricane. Inertial-confinement fusion with lasers. Nat. Phys., 12, 435(2016).
[8] T. J. B. Collins, K. S. Anderson, M. Lafon, R. Betti, R. Epstein. Direct-drive–ignition designs with mid-Z ablators. Phys. Plasmas, 22, 032703(2015).
[9] Y. Ding, J. Yang, F. Wang, S. Jiang, S. Liu. Experimental progress of inertial confinement fusion based at the ShengGuang-III laser facility in China. Nucl. Fusion, 59, 032006(2019).
[10] Y. Mei, H. Wei, T. Xu, F. Wang, X. Peng. A full aperture backscattering light diagnostic system installed on the Shenguang-III prototype laser facility. Plasma Sci. Technol., 16, 567-570(2014).
[11] X. S. Peng, F. Wang, D. Yang, H. Y. Wei, T. Xu et al. Characteristics study of the backscattering light on Shenguang-III prototype. Acta Opt. Sin., 34, 0314004(2014).
[12] Y. Ding, L. Zhang, H. Li, Z. Lin, L. Jing. Demonstration of enhancement of x-ray flux with foam gold compared to solid gold. Nucl. Fusion, 56, 036006(2016).
[13] D. A. Callahan, S. W. Haan, J. D. Lindl, D. S. Clark, J. D. Salmonson. Point design targets, specifications, and requirements for the 2010 ignition campaign on the national ignition facility. Phys. Plasmas, 18, 051001(2011).
[14] D. A. Callahan, N. B. Meezan, O. A. Hurricane, M. J. Edwards, P. K. Patel et al. Indirect drive ignition at the national ignition facility. Plasma Phys. Controlled Fusion, 59, 014021(2017).
[15] J. Grun, E. A. McLean, S. P. Obenschain, B. H. Ripin. Uniformity of laser-driven, ablatively accelerated targets. Phys. Rev. Lett., 46, 1402(1981).
[16] E. A. McLean, R. R. Whitlock, J. A. Stamper, H. R. Griem, S. H. Gold. Preheat studies for foils accelerated by ablation due to laser irradiation. Phys. Rev. Lett., 45, 1246(1980).
[17] R. Fabbro, B. Faral, J. P. Romain, F. Cottet. Simple measurement of the velocity of planar laser accelerated targets with stepped double-foil technique. Opt. Commun., 49, 352(1984).
[18] C. Thomas, E. L. Dewald, N. Meezan, S. Hunter, L. Divol. Hot electron measurements in ignition relevant Hohlraums on the National Ignition Facility. Rev. Sci. Instrum., 81, 10D938(2010).
[19] J. J. Lee, M. Hohenberger, N. E. Palmer, F. Albert, T. Döppner et al. Time-resolved measurements of the hot-electron population in ignition-scale experiments on the National Ignition Facility (invited). Rev. Sci. Instrum., 85, 11D501(2014).
[20] P. M. Bell, D. L. Bleuel, J. A. Caggiano, D. K. Bradley, J. D. Kilkenny. The National Ignition Facility diagnostic set at the completion of the National Ignition Campaign, September 2012. Fusion Sci. Technol., 69, 420(2016).
[21] P. M. Bell, J. P. Holder, D. K. Kalantar, J. R. Kimbrough, D. K. Bradley. Standard design for National Ignition Facility x-ray streak and framing cameras. Rev. Sci. Instrum., 81, 10E530(2010).
[22] S. M. Glenn, D. K. Bradley, C. G. Brown, L. R. Benedetti, P. M. Bell. Crosstalk in x-ray framing cameras: Effect on voltage, gain, and timing (invited). Rev. Sci. Instrum., 83, 10E135(2012).
[23] G. Stone, C. Hagmann, N. Izumi, S. Glenn, D. Hey. Experimental study of neutron induced background noise on gated x-ray framing cameras. Rev. Sci. Instrum., 81, 10E515(2010).
[24] E. Foerster, I. Uschmann, K. Gaebel. x-ray microscopy of laser-produced plasmas with the use of bent crystals. Laser Part. Beams, 9, 135(1991).
[25] O. L. Landen, T. W. Barbee, J. A. Koch, P. Celliers, L. B. Da Silva. High-energy x-ray microscopy techniques for laser-fusion plasma research at the National Ignition Facility. Appl. Opt., 37, 1784(1998).
[26] S. M. Lane, K. A. Nugent, R. A. Lerche, R. J. Ellis, D. Ress. Neutron imaging of laser fusion targets. Science, 241, 956(1988).
[27] M. Su, B. Yu, T. X. Huang, B. L. Chen, W. Jiang et al. Design of diagnostic system for neutron penumbral imaging based on Shenguang-III facility. High Power Laser Part. Beams, 25, 2604(2013).
[28] W. Theobald, C. Stoeckl, J. P. Knauer, T. C. Sangster, V. Y. Glebov. The National Ignition Facility neutron time-of-flight system and its initial performance (invited). Rev. Sci. Instrum., 81, 10D325(2010).
[29] M. J. Rosenberg, H. G. Rinderknecht, N. Sinenian, M. G. Johnson, A. B. Zylstra. A novel particle time of flight diagnostic for measurements of shock- and compression-bang times in D3He and DT implosions at the NIF. Rev. Sci. Instrum., 83, 10D902(2012).
[30] X.-Y. Zhan, Z.-F. Song, J.-B. Chen, Z.-J. Liu, Q. Tang. An improved method of unfolding neutron TOF spectrum for low ion temperature inertial confinement fusion. Chin. Phys. C, 38, 066201(2014).