Abstract
In this Letter, a low-frequency acoustic sensor based on an extrinsic Fabry–Pérot (FP) interferometer with a silicon nitride (Si3N4) membrane is demonstrated. Using micromachining techniques, the 800 nm thick Si3N4 membrane is deposited on an 8 mm × 8 mm × 400 μm silicon (Si) substrate. All the assembly procedures of the sensor are focused on the substrate to avoid any damage to the membrane itself, compared to general membrane transfer methods. The frequency response of the proposed sensor is discussed theoretically and experimentally demonstrated. The sensor exhibits an excellent flat response to the tested acoustic frequency range of 1 Hz to 250 Hz. The phase sensitivity is around ?152 dB re 1 rad/μPa with sensitivity fluctuation less than 0.8 dB. The frequency response characteristic shows a promising potential of the sensor in low-frequency acoustic signal sensing applications.The acoustic vibration, which covers low-frequency to infrasound regions, has the ability to travel with low propagation loss in many kinds of media, especially in solid and fluid materials. With the help of acoustic sensors to collect character signals and information, all advantages mentioned above show us an efficient way to forecast natural phenomena such as earthquakes[1], tornadoes[2], volcano eruptions[3,4], and sudden stratospheric warming[5], or to monitor the structural health of pipelines[6], mining blasts[7], and so on.
In comparison with electronic acoustic sensors[8–10], the optical fiber sensor is getting more and more attention due to its nature of light weight, compact size, low transmission loss, and high resistance to severe physical and chemical environments[11]. For acoustic sensing purposes, various kinds of fiber sensors have been developed based on fiber interferometers[12–18], fiber gratings[6,19,20], and fiber lasers[21,22], in which extrinsic Fabry–Pérot (FP) sensors with membrane structures are promising choices because of the characteristics of high sensitivity, miniature size, and multiplexing ability[23–27]. The interference structure of FP is easy to form, granting not only a simple structure that can fit into miscellaneous sensing environments, but also low thermal noise and polarization-induced fading. In the fabrication of FP sensors based on membranes, a large uncertainty is introduced while the membrane is detached from photoresist layer and fixed on sensor sleeves manually by glue, especially when the welding requires heating. All of the procedures above have great possibilities to cause non-uniform stress distribution and defects in the membrane, leading to a degraded acoustic sensitivity and repeatability. Most of all, the roughness and unwanted pre-deformation of the membrane tend to influence the flatness of frequency response, usually happening in low-frequency to infrasound scales. For instance, in Ref. [28], the micromachining-based FP acoustic sensor using acetone for membrane release has a fluctuation larger than 12 dB in the frequency response below 1 kHz, making it hard for low-frequency sensing[29,30], where the parylene-C and polyethylene terephthalate (PET) membranes are adhered to sensor sleeves, and both have relatively rugged frequency responses to acoustic signals. Therefore, it is important to find methods to minimize the disturbance of the membrane properties during the preparation so that optimal acoustic sensing characteristic can be achieved.
In this Letter, an extrinsic FP sensor based on a membrane prepared by the micro electro mechanical systems (MEMS) fabrication process is proposed, aiming at low-frequency acoustic signal sensing. Pieces of the membrane of 800 nm thickness and 3.5 mm radius are deposited and etched on the Si substrate in large numbers. Instead of membrane transfer, the Si substrate is handled and glued to other sensor parts in order to avoid unnecessary influence on the membrane. The designed single-layer membrane features simpler fabrication processes than many sensors that use MEMS techniques[26,31–33]. It also shows a lower minimum detection frequency as well as better flatness of response in the low-frequency region compared to the reports involving this technique from researchers[28,31,34]. Additionally, the sensor’s noise that may result from thermal expansion coefficient (TEC) mismatch of multiple membrane layers can be suppressed, hence optimizing the sensor’s resistance to environmental changes. A flat frequency response in the range from 1 to 250 Hz is demonstrated in the experiment, and the sound pressure sensitivity (SPS) is about −152 dB re 1 rad/μPa with the fluctuation less than 0.8 dB. The noise equivalent pressure (NEP) is around 30 dB when the signal frequency is beyond 25 Hz. The result shows a great potential for low-frequency acoustic signal sensing in mining operations, hydrophone application areas, etc.
Sign up for Chinese Optics Letters TOC. Get the latest issue of Chinese Optics Letters delivered right to you!Sign up now
According to the acoustics theory, the sensor membrane can be regarded as an edge-fixed thin layer whose vibration balance is maintained by the tension of the elastic membrane material. When the membrane is driven by an acoustic signal , the forced oscillation function of the membrane unit is expressed by Eq. (1)[35]:where , , , and represent the displacement from balancing position, the density (), the thickness, and the tension of the membrane (N/m). Due to the symmetrical structure of the membrane, Eq. (1) is solved in the polar coordinate system, where is the function of time and the distance to origin , shown in Eqs. (2) and (3):where is the zero-order Bessel function. For the edge-fixed boundary condition, when the radius of membrane is , , thus displacement can be further expressed as Eq. (4):
This solution indicates that will reach its maximum when condition is met. Therefore, the resonant frequencies of the membrane can be derived as Eq. (5):where represents the roots of . In addition, the displacement sensitivity and phase sensitivity at the membrane center is given by Eqs. (6) and (7):
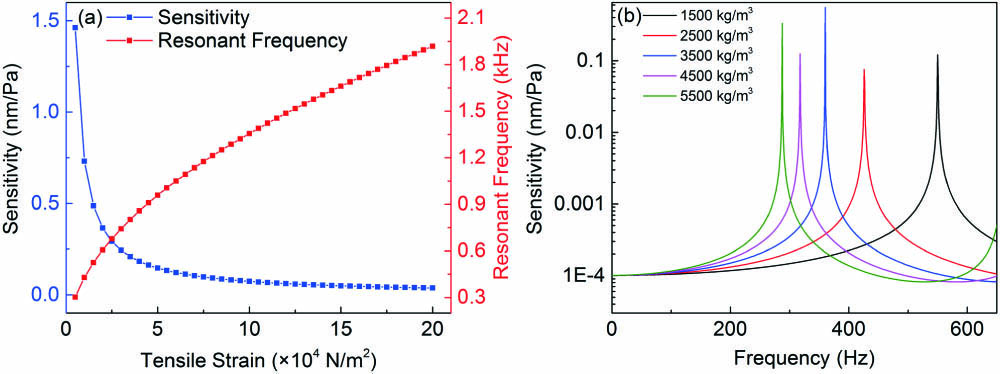
By changing the tensile strain and density of the membrane, the relationship among these variations, the resonant frequency, and the sensitivity of the membrane can be obtained, shown in Fig. 1.

Figure 1.(a) Sensitivity and resonant frequency of the membrane with difference tensile strain; (b) frequency response of the membrane with different densities.
It is clear that the tensile strain or tension in the membrane plays an important role in sensor frequency response characteristics. During membrane fabrication, the direct operation to membrane itself should be avoided to prevent strain introduction that may have great impact on its resonant frequency and sensitivity. There is an obvious existence of a flat response region much lower than the first-order resonance frequency, indicating a uniform response of the proposed sensor design in the low-frequency acoustic signal. In order to achieve a wider range of flat response, membrane materials with lower density should be used to increase the resonant frequency, though the sensitivity will drop a little, for which the bandwidth of flat response and sensitivity need to be balanced in membrane design. Therefore, the commonly used is chosen, whose density around is much smaller than that of metallic materials, and, with the membrane of and for compact sensor design, the resonance frequency is calculated to be 418 Hz.
When designing a fiber sensor based on an extrinsic FP interferometer (EFPI), an optimum free spectral range (FSR) and a relatively high contrast of the interference spectrum pattern should be guaranteed to obtain demodulation results of good quality and accuracy. When two reflective surfaces of the FP cavity have low reflectance and , only the first-order light that is reflected by the fiber facet and membrane is coupled and is strong enough to form the interference. In actual situations, when using the membrane as one of the reflective surfaces, part of the light will pierce into the membrane, be reflected by the membrane–air boundary, and eventually couple back to the input fiber. Thus, three-beam interference is formed in fact, causing additional variance in the output spectrum. In the interference simulation, FP cavity length is changed to find the proper cavity length range with high spectrum contrast. With input light electric field amplitude , fiber reflectivity , and membrane thickness , the simulated spectrum and extinction ratio of the interference with variation is shown in Fig. 2.
Figure 2.Simulation results of three-beam interference: (a) the original interference spectrum and its Fourier transform; (b) the interference extinction ratio under different FP cavity lengths .
It can be seen from simulation that the cavity length ranges from 110 μm to 220 μm, corresponding to an FSR of 5 nm to 10 nm, will provide an relatively high extinction ratio, which grants a proper contrast of the output spectrum for signal demodulation. Three-beam interference is the cause of the envelope in the spectrum. The result also indicates that by controlling the length of the FP cavity, it is possible to get spectrum that meets the requirement for sensing purpose without additional metallic layers on the membrane to improve its reflectivity.
The fabrication process of the membrane is shown in Fig. 3. Low-pressure chemical vapor deposition (LPCVD) is adopted to mount an 800 nm thick film on the Si substrate. On the back side of the substrate, a layer of is deposited as the masking layer for back side Si deep etching (SDE) by plasma enhanced chemical vapor deposition (PECVD). A groove of 350 μm depth and 5 mm diameter is carved using reactive ion etching (RIE), and the FP cavity is etched, releasing the 3.5 mm diameter membrane area from the substrate. As is discussed above, a single layer of is enough for a contrasting interference in the FP sensor, so the deposition of an additional metal layer can be omitted, for the simplification of the membrane fabrication process. Moreover, since the TECs of most metallic materials are much larger than that of the membrane and the Si substrate, the thermal stability of the sensor is improved without a metal-included multilayer structured sensing membrane, enhancing the resistance of environmental temperature change during work.
Figure 3.Schematic diagram of membrane fabrication.
After the membrane is completely fabricated on the substrate piece, it is assembled with other parts, which compose the proposed FP sensor structure. For the convenience of sensing performance tests, an assembly using a cylindrical shell made of copper is designed, shown in Fig. 4(a). The membrane is sunk into one end of the copper shell, into which the fiber and ferrule can be inserted from the hole on the other end. The ceramic sleeve and ferrule are proposed to fix the input fiber, making its end facet face directly to the center of the membrane, where the maximum sensitivity is obtained. Since there is a huge TEC difference between the shell and the rest of the sensor, when the surrounding environment has unstable disturbance in a large temperature scale, the size mismatch caused by thermal expansion will stretch or squeeze sensor parts, hence introducing thermal noise, which changes the sensing characteristics or even damages the sensor structure. However, in our experiment, the use of the copper shell assembly has negligible influence upon the test of the sensor’s acoustic response, because the sensing performance is mainly determined by the membrane instead of the subsequent process of sensor fabrication, especially in a stable lab testing environment, which has no obvious temperature variations. Consequently, due to the small size of the membrane and its substrate, a more compact package design of the SiN-MEMS sensor can be adopted instead of the large metallic shell in practical applications.
Figure 4.(a) Schematic diagram of sensor structure; (b) photo of the SiN-MEMS sensor; (c) reflection spectrum and spatial frequency spectrum of the sensor.
The cavity length of the FP sensor is carefully adjusted by the three-dimensional (3D) adjustment stage when the fiber and ferrule are inserted into the ceramic sleeve. The sensor is connected through a circulator to an optical spectrum analyzer (OSA, Yokogawa AQ6370c) to observe the interference spectrum during the length adjustment of the FP cavity. The reflection spectrum of the SiN-MEMS sensor and its spatial frequency spectrum are shown in Fig. 4(c).
To characterize the frequency response of the proposed SiN-MEMS sensor, the experimental setup is demonstrated in Fig. 5. Light from a broadband amplified spontaneous emission (ASE) source travels through the circulator to illuminate the SiN-MEMS sensor placed inside the chamber of a low-frequency comparison coupler (B&K WB-3570). A standard microphone (B&K 4193-L-004) is also inside for sound pressure calibration purpose. A low-frequency sinusoidal acoustic signal is generated and then received by FP sensors so that its interference is modulated by the periodic sound wave. The reflected light of the sensor is coupled back into the circulator, and the signal is collected by a fiber Bragg grating analyzer (FBGA) interrogator. With the time sampling rate of , data of the FP spectrum, which ranges from 1520 nm to 1570 nm and contains 512 data points per time frame, is recorded by the FBGA interrogator, and the demodulation process is carried out in a personal computer. As phase modulation is introduced into the collected interference data, the phase information is extracted from the intrinsic spatial frequency of the FP sensor in the fast Fourier transform (FFT) spectrum to recover the acoustic signal. This kind of white light interferometry phase demodulation method is discussed in our previous work[36], which is suitable for low-frequency dynamic signal detection.
Figure 5.(a) Experimental setup of frequency response testing; (b) picture of the low-frequency comparison coupler.
During the experiment, the acoustic signal ranging from 0.1 Hz to 250 Hz is applied to the SiN-MEMS sensor to prove its low-frequency sensing ability. The testing frequency range is limited by the acoustic source and FBGA time sampling rate. White light phase demodulation based on fast Fourier analysis is adopted in signal interrogation, in which data can be calculated by LabVIEW or MATLAB programs. After the phase-time results are completely demodulated, the spectra in the frequency domain are also obtained by FFT for a better view of the sensor’s acoustic response capability. The phase-time result and FFT spectra of demodulation are shown in Fig. 6.
Figure 6.(a) Result of acoustic signal demodulation of SiN-MEMS sensor; (b) FFT spectra of demodulation results.
The result shows that all of the tested frequencies can be clearly distinguished, presenting a fine low-frequency response of the proposed SiN-MEMS sensor. In order to eliminate the inaccuracy in the SPS calibration caused by random noise, sinusoidal fitting is applied to the result of demodulation so that the amplitude of periodic phase change over time can be extracted in a more precise way. With the assistance of the standard microphone in the test, the acoustic pressures under different frequencies generated are precisely calibrated so that the SPS to these frequencies can be calculated. By Eq. (8), the SPS is presented in the unit of decibels (dB), taking 1 rad/μPa as the reference:
In order to have a further evaluation for the noise characteristics of the SiN-MEMS sensor, the signal-to-noise ratio (SNR) of each testing frequency is measured. The demodulation results with and without acoustic signals are obtained by controlled experiments, and their FFT spectra are compared to acquire the corresponding SNR under certain acoustic frequencies. Combined with the calibrated sound pressure information, the NEP is concluded. The way of SNR calculation, the noise characteristics of SiN-MEMS sensor, and the comparison of simulation to experimental data is demonstrated in Fig. 7.
Figure 7.(a) SNR of FFT result; (b) phase sensitivity and noise characteristics of SiN-MEMS sensor; (c) sensitivity comparison of simulation to experimental data.
It is obvious that the SiN-MEMS sensor has a flat frequency response from 1 Hz to 250 Hz, and the SPS is around −152 dB, with a fluctuation smaller than 0.8 dB. This result is consistent with the membrane forced vibration model that is applied to the simulation of SPS. The tensile strain of the membrane is unknown before the experiment, so it is estimated to be about by comparing simulation and experimental results. There is an acceptable difference of about 5 dB because of the numerical difference between values used in calculation and the actual experiment; therefore, the resonant frequency of the SiN-MEMS sensor is larger than the simulation according to the trend of experiment data, with an expected wider range of the flat frequency response region. The sudden increase and decrease of SPS below 1 Hz may be caused by deterioration of the signal generator properties in the comparison coupler and the standard microphone calibration. The NEP of the sensor drops as the acoustic frequency becomes larger and goes down to around 30 dB when the frequency is beyond 25 Hz, which is similar to the tendency of the background noise level. The high NEP in the frequency region lower than 10 Hz results from a considerable SNR deterioration under domination of noise. Generally, in comparison to our previous work[26], the proposed SiN-MEMS acoustic sensor has similar features of very flat low-frequency to infrasound response, while achieving improvements in acoustic SPS as well as having low NEPs in the meantime.
In conclusion, an extrinsic FP acoustic sensor based on a membrane with MEMS fabrication techniques is proposed and experimentally demonstrated. Without any multilayer structures or transfer need, the membrane is fabricated and fixed to the sensor sleeve by more simple and controllable procedures, which stablize the sensor’s sensing characteristics, improve repeatability, and lower the noise. In the tested sound frequency response range of 0.1 to 250 Hz, the SiN-MEMS sensor features a remarkable flat response with fluctuations less than 0.8 dB. The SPS within this range is around . The proposed sensor exhibits huge potential in harsh environment sensing applications such as disaster monitoring and underwater signal detection.
References
[1] L. G. Evers, D. J. Brown, K. D. Heaney, J. D. Assink. J. Acoust. Soc. Am., 137, 2372(2015).
[2] W. G. Frazier, C. Talmadge, J. Park, R. Waxler, J. Assink. J. Acoust. Soc. Am., 135, 1742(2014).
[3] D. Fee, R. S. Matoza. J. Volcanol. Geotherm. Res., 249, 123(2013).
[4] M. M. Haney, A. R. V. Eaton, J. J. Lyons, R. L. Kramer, D. Fee, A. M. Iezzi. Geophys. Res. Lett., 45, 3429(2018).
[5] P. S. M. Smets, J. D. Assink, A. Le Pichon, L. G. Evers. J. Geophys. Res., 121, 1(2016).
[6] A. Bedi, V. Kothari, S. Kumar. Proc. SPIE, 10488, 104880X(2018).
[7] M. T. Hagerty, W. Kim, P. Martysevich. Pure Appl. Geophys., 159, 1063(2002).
[8] T. T. C. Palitó, Y. A. O. Assagra, R. A. P. Altafim, J. P. Carmo, R. A. C. Altafim. Electron. Lett., 55, 203(2019).
[9] A. Nagaty, A. Mehaney, A. H. Aly. J. Supercond. Novel Magn., 31, 4173(2018).
[10] J. Lee, J. H. Jeon, Y. G. Kim, S. Q. Lee, W. S. Yang, J. S. Lee, S. G. Lee. Electron. Lett., 52, 468(2016).
[11] B. H. Lee, Y. H. Kim, K. S. Park, J. B. Eom, M. J. Kim, B. S. Rho, H. Y. Choi. Sensors, 12, 2467(2012).
[12] G. Sui, H. Liu, F. Pang, J. Cheng, T. Wang. Photon. Sens., 9, 230(2019).
[13] R. Gao, H. Wang, D. Zhu, G. Fan, H. Yan, P. Wang, Y. Liu, Y. Wang, W. Liu, L. Song, C. Wang, Y. Chen. Sens. Actuat. A, 271, 243(2018).
[14] R. Wonko, J. E. Moś, K. A. Stasiewicz, L. R. Jaroszewicz. Proc. SPIE, 10231, 1023123(2017).
[15] H. Xu, G. Wang, J. Ma, L. Jin, K. Oh, B. Guan. Opt. Express, 26, 11976(2018).
[16] D. Pawar, C. N. Rao, R. K. Choubey, S. N. Kale. Appl. Phys. Lett., 108, 041912(2016).
[17] S. Wu, L. Wang, X. Chen, B. Zhou. J. Lightwave Technol., 36, 2216(2018).
[18] S. Dass, R. Jha. J. Lightwave Technol., 35, 5411(2017).
[19] C. Li, X. Peng, H. Zhang, C. Wang, S. Fan, S. Cao. Meas., 117, 252(2018).
[20] M. Ghorat, G. B. Gharehpetian, H. Latifi, M. A. Hejazi, A. Layeghi. Opt. Eng., 57, 074107(2018).
[21] T. Yang, Y. Song, W. Zhang, F. Li. Chin. Opt. Lett., 14, 120602(2016).
[22] R. Ma, W. Zhang, W. Huang, F. Li. Chin. Opt. Lett., 16, 060602(2018).
[23] J. Ma, H. Xuan, H. L. Ho, W. Jin, Y. Yang, S. Fan. IEEE Photon. Technol. Lett, 25, 932(2013).
[24] W. Ni, P. Lu, X. Fu, W. Zhang, P. P. Shum, H. Sun, C. Yang, D. Liu, J. Zhang. Opt. Express, 26, 20758(2018).
[25] L. Liu, P. Lu, S. Wang, X. Fu, Y. Sun, D. Liu, J. Zhang, H. Xu, Q. Yao. IEEE Photon. J., 8, 6800709(2016).
[26] X. Fu, P. Lu, J. Zhang, Z. Qu, W. Zhang, Y. Li, P. Hu, W. Yan, W. Ni, D. Liu, J. Zhang. Opt. Express, 27, 24300(2019).
[27] W. Si, C. Fu, D. Li, H. Li, P. Yuan, Y. Yu. Sensors, 18, C1(2018).
[28] B. Liu, J. Lin, J. Wang, C. Ye, P. Jin. IEEE Photon. Technol. Lett, 28, 581(2016).
[29] Z. Gong, K. Chen, X. Zhou, Y. Yang, Z. Zhao, H. Zou, Q. Yu. J. Lightwave Technol., 35, 5276(2017).
[30] S. Wang, P. Lu, L. Liu, H. Liao, Y. Sun, W. Ni, X. Fu, X. Jiang, D. Liu, J. Zhang, H. Xu, Q. Yao, Y. Chen. IEEE Photon. Technol. Lett., 28, 1264(2016).
[31] J. Xia, F. Wang, H. Luo, Y. Hu, S. Xiong. IOP Conf. Ser.: Mater. Sci. Eng, 281, 21094(2017).
[32] X. Lu, Y. Wu, Y. Gong, Y. Rao. J. Lightwave Technol., 36, 5224(2018).
[33] F. Wang, Z. Shao, Z. Hu, H. Luo, J. Xie. Proc. SPIE, 9283, 928308(2014).
[34] Z. Li, J. Shao, Z. Wu, J. Chen. Lect. Notes Electr. Eng., 132, 473(2011).
[35] Z. Zhu, X. Gong, G. Du. Fundamentals of Acoustics(2001).
[36] X. Fu, P. Lu, W. Ni, H. Liao, D. Liu, J. Zhang. Opt. Express, 25, 21094(2017).