
Xizheng Ke, Shangjun Yang, Jiali Wu, Xirui Zhong. Research progress of adaptive optics in wireless optical communication system for Xi’an University of Technology[J]. High Power Laser and Particle Beams, 2021, 33(8): 081003
- High Power Laser and Particle Beams
- Vol. 33, Issue 8, 081003 (2021)
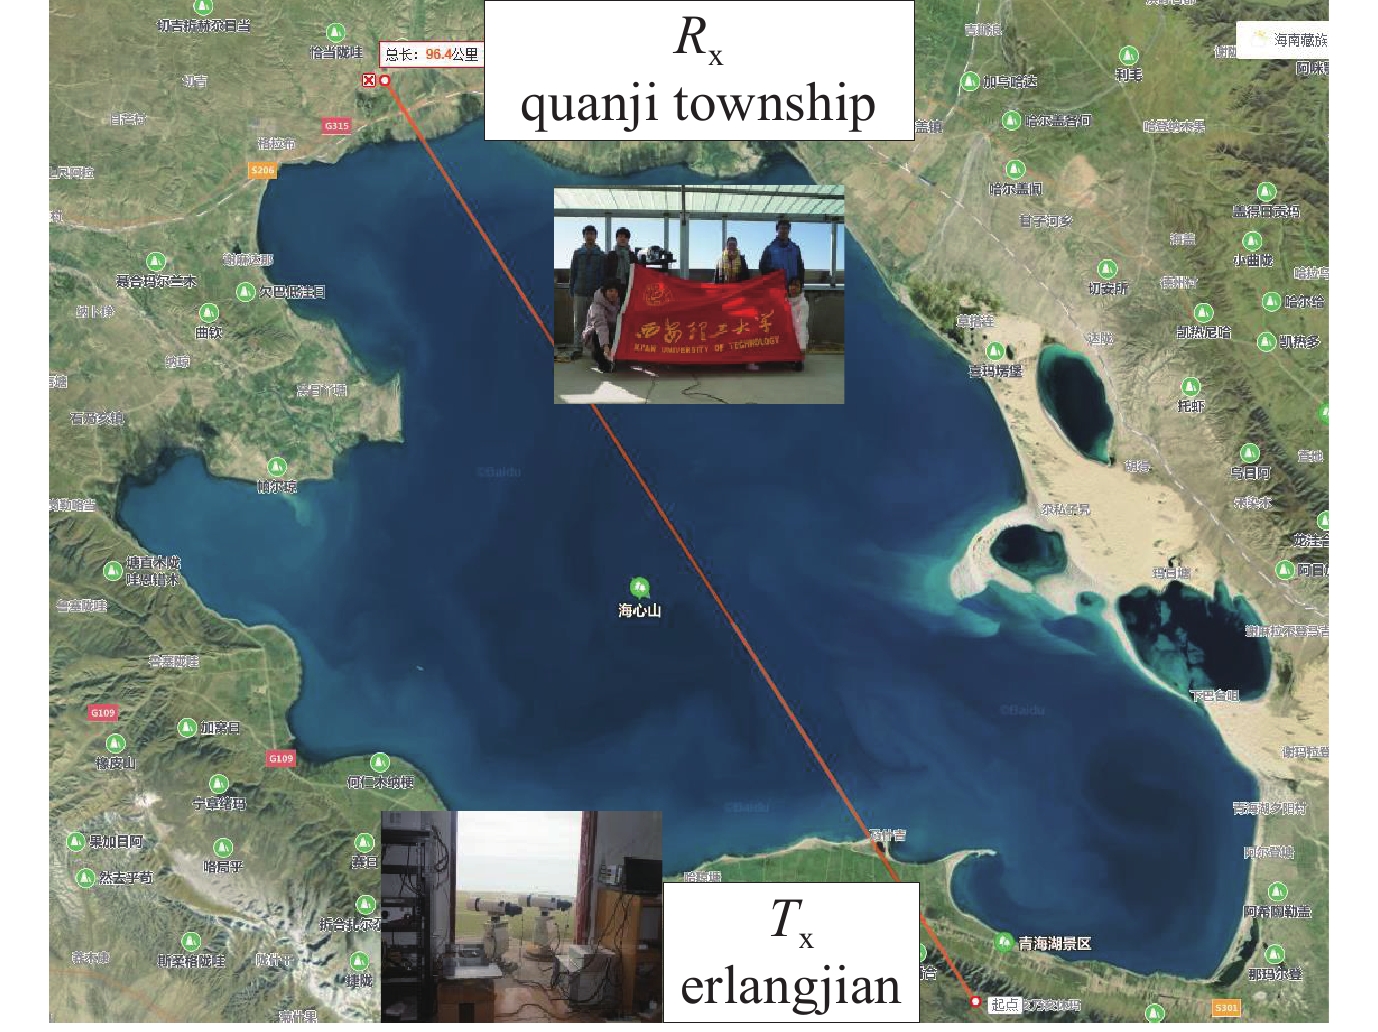
Fig. 1. Diagram of 100 km of Xi’an University of Technology wireless optical communication experimental link
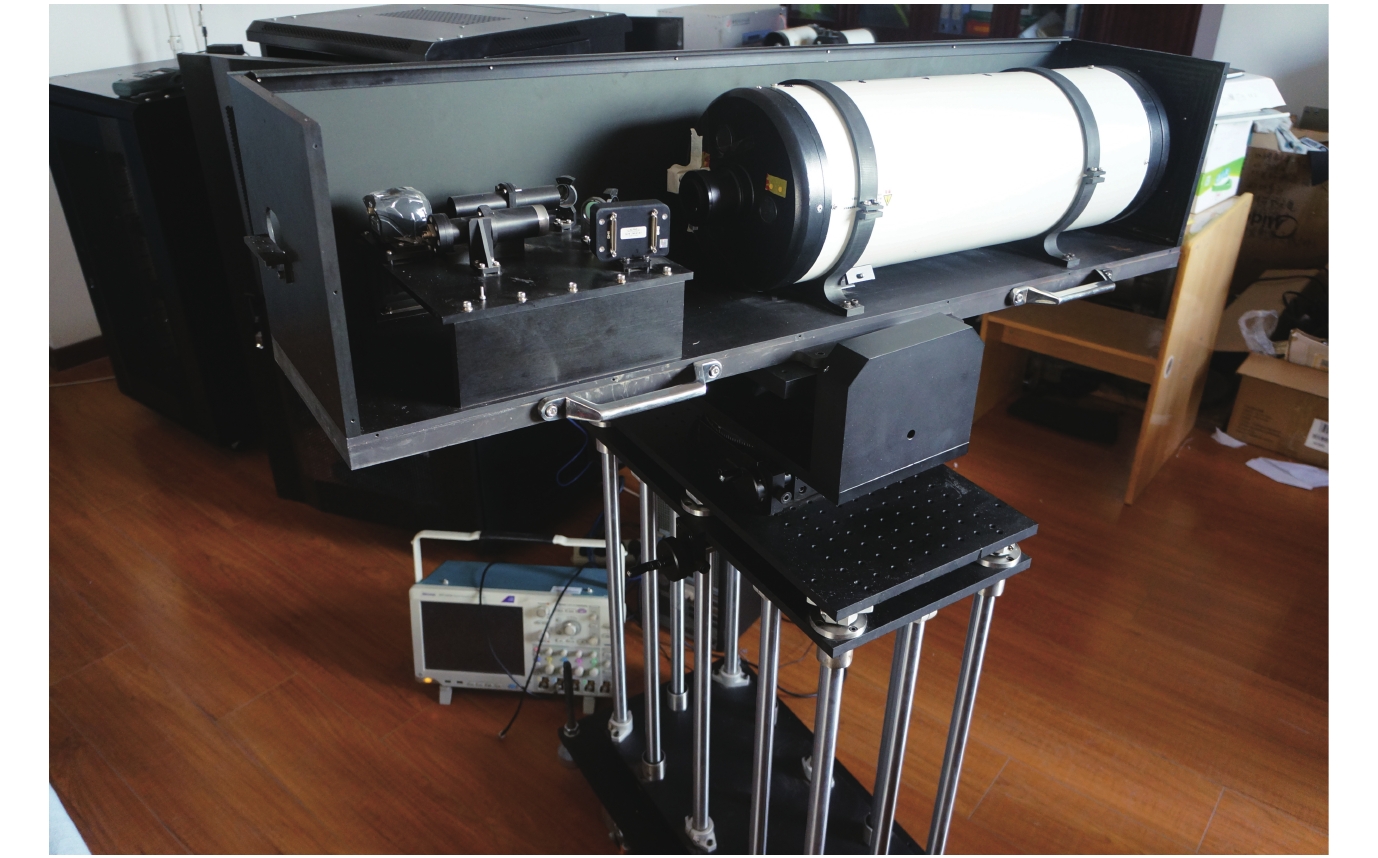
Fig. 2. Photo of internal structure of wireless coherent optical communication
Fig. 3. Structure of adaptive optics research content
Fig. 4. Schematic diagram of adaptive optics system
Fig. 5. Structure diagram of adaptive optics system with wavefront
Fig. 6. Push-pull method driving the 10th driver (a) deformable mirror shape diagram (b) wavefront slope diagram
Fig. 7. Interaction matrices
Fig. 8. Schematic diagram of adaptive optics PID control algorithm
Fig. 14. PV curve of wavefront corrected by fuzzy control[100]
Fig. 15. Adaptive optics wavefront prediction and correction
Fig. 16. Wavefrontless adaptive optics system
Fig. 17. Deformable mirror eigen mode corrected light intensity SR change curve[107]
Fig. 18. Light spot by wavefront correction[107]
Fig. 19. Wavefront correction based on SPGD algorithm[114]
Fig. 20. Optimal optical fiber coupling correction curve after wavefrontless correction[115]
Fig. 21. Intensity distribution of vortex beams before and after correction by phase recovery Gerchberg-Saxton algorithm[117](a1)~(d1) no turbulence, (a2)~(d2) has turbulence, (a3)~(d3) correction
Fig. 22. Intensity distribution of single vortex beam corrected by phase difference method[119](a1)~(c1) initial light intensity, (a2)~(c2) the light intensity at the focal plane, (a3)~(c3) intensity at defocus plane, (a4)~(c4) corrected light intensity
Fig. 23. Schematic diagram of LC-SLM wavefront correction in wireless coherent optical communication system[120]
Fig. 24. Amplitude of immediate frequency signal before and after correction[122]
Fig. 25. PV convergence curve of multi-corrector wavefront correction
Fig. 26. Wavefront phase of adaptive optics system based on TM and DM combination
Fig. 27. Voltage change while using simulated annealing algorithm[127]
Fig. 28. Variation curve of coupling optical power with iteration times under different deviations[128]
Fig. 29. Mode conversion results[131]
Fig. 30. Schematic diagram of adaptive optics wavefront correction optical fiber coupling control system
Fig. 31. Effect of non-common optical path aberration on closed-loop coupling power and wavefront phase of adaptive optics
Fig. 32. Variation curve of fiber coupling power before and after adaptive optics wavefront correction
Fig. 33. Effect curve of wavefront correction on coupling efficiency at different distances


Set citation alerts for the article
Please enter your email address

© Copyright 2018-2021 | Chinese Laser Press. All Rights Reserved 沪ICP备15018463号-20