• Spectroscopy and Spectral Analysis
  • Vol. 42, Issue 9, 2935 (2022)
Zhao-jia PIAO*, Hai-ye YU, Jun-he ZHANG, Hai-gen ZHOU, Shuang LIU, Li-juan KONG, and Jing-min DANG*;
Author Affiliations
  • College of Biological and Agricultural Engineering, Jilin University, Changchun 130022, China
  • show less
    DOI: 10.3964/j.issn.1000-0593(2022)09-2935-06 Cite this Article
    Zhao-jia PIAO, Hai-ye YU, Jun-he ZHANG, Hai-gen ZHOU, Shuang LIU, Li-juan KONG, Jing-min DANG. Hyperspectral Inversion Model of Pectin Content in Wheat Under Salt and Physical Damage Stresses[J]. Spectroscopy and Spectral Analysis, 2022, 42(9): 2935 Copy Citation Text show less
    Changes of pectin content in wheat leaves under different stress factors in the first week(a): Under single stress factor; (b): Under multiple stress factors
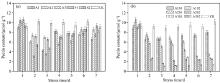
    Fig. 1. Changes of pectin content in wheat leaves under different stress factors in the first week
    (a): Under single stress factor; (b): Under multiple stress factors
    Average pectin contents in wheat leaves corresponding to different stress factors in the first weekDifferent lowercase letters indicate the significant difference between different treatments at p<0.05 (a): Single stress factor; (b): Multiple stress factors
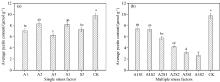
    Fig. 2. Average pectin contents in wheat leaves corresponding to different stress factors in the first week
    Different lowercase letters indicate the significant difference between different treatments at p<0.05 (a): Single stress factor; (b): Multiple stress factors
    Hyperspectral characteristics of wheat leaves under different stress factors(a): Under single stress factor; (b): Under multiple stress factors
    Fig. 3. Hyperspectral characteristics of wheat leaves under different stress factors
    (a): Under single stress factor; (b): Under multiple stress factors
    Characteristic wavelength extraction by correlation coefficient method(a): Correlation between original spectra and pectin content in wheat leaves; (b): Correlation between first-derivative spectra and pectin content in wheat leaves
    Fig. 4. Characteristic wavelength extraction by correlation coefficient method
    (a): Correlation between original spectra and pectin content in wheat leaves; (b): Correlation between first-derivative spectra and pectin content in wheat leaves
    (a) The relationship between the pectin content predicted by the optimal model and the pectin content measured by the kit; (b) Precision evaluation of the proposed pectin prediction model
    Fig. 5. (a) The relationship between the pectin content predicted by the optimal model and the pectin content measured by the kit; (b) Precision evaluation of the proposed pectin prediction model
    分组盐胁迫物理损伤
    单因素
    胁迫
    实验
    A150 mmol·L-1 NaCl-
    A2100 mmol·L-1 NaCl-
    A3150 mmol·L-1 NaCl-
    S1-针刺10孔
    S2-针刺30孔
    CK--
    复合
    胁迫
    实验
    A1S150 mmol·L-1 NaCl针刺10孔
    A1S250 mmol·L-1 NaCl针刺30孔
    A2S1100 mmol·L-1 NaCl针刺10孔
    A2S2100 mmol·L-1 NaCl针刺30孔
    A3S1150 mmol·L-1 NaCl针刺10孔
    A3S2150 mmol·L-1 NaCl针刺30孔
    CK--
    Table 1. Experimental design of salt and physical damage stresses
    建模对象建模方法预处理方法RcRp
    果胶含量PCRMSC+SG(W702~728)0.902 40.880 1
    SNV+SG(W702~728)0.917 60.908 7
    MSC+FD+SG(W690~700)0.906 60.877 8
    MSC+FD+NDF(W690~700)0.941 10.950 6
    SNV+FD+SG(W690~700)0.927 40.920 4
    SNV+FD+NDF(W690~700)0.936 00.943 8
    FD(W690~700)0.851 50.860 6
    W702~7280.872 50.854 8
    0.862 40.821 1
    果胶含量PLSMSC+SG(W702~728)0.914 50.918 8
    SNV+SG(W702~728)0.912 10.906 4
    MSC+FD+SG(W690~700)0.961 20.938 2
    MSC+FD+NDF(W690~700)0.948 80.896 7
    SNV+FD+SG(W690~700)0.952 00.930 4
    SNV+FD+NDF(W690~700)0.978 20.981 4
    FD(W690~700)0.917 40.905 8
    W702~7280.887 60.893 4
    0.876 80.889 2
    果胶含量SMLRMSC+SG(W702~728)0.876 50.877 8
    SNV+SG(W702~728)0.874 80.890 2
    MSC+FD+SG(W690~700)0.900 30.899 6
    MSC+FD+NDF(W690~700)0.871 40.902 8
    SNV+FD+SG(W690~700)0.802 80.788 6
    SNV+FD+NDF(W690~700)0.791 00.768 4
    FD(W690~700)0.785 50.817 3
    W702~7280.814 00.828 0
    0.779 10.773 6
    Table 2. Prediction models obtained by different modeling methods and preprocessing techniques
    Zhao-jia PIAO, Hai-ye YU, Jun-he ZHANG, Hai-gen ZHOU, Shuang LIU, Li-juan KONG, Jing-min DANG. Hyperspectral Inversion Model of Pectin Content in Wheat Under Salt and Physical Damage Stresses[J]. Spectroscopy and Spectral Analysis, 2022, 42(9): 2935
    Download Citation