
Chuankang Li, Yuzhu Li, Zhengyi Zhan, Yuhang Li, Xin Liu, Yong Liu, Xiang Hao, Cuifang Kuang, Xu Liu. Sub-diffraction dark spot localization microscopy[J]. Photonics Research, 2021, 9(8): 1455
- Photonics Research
- Vol. 9, Issue 8, 1455 (2021)
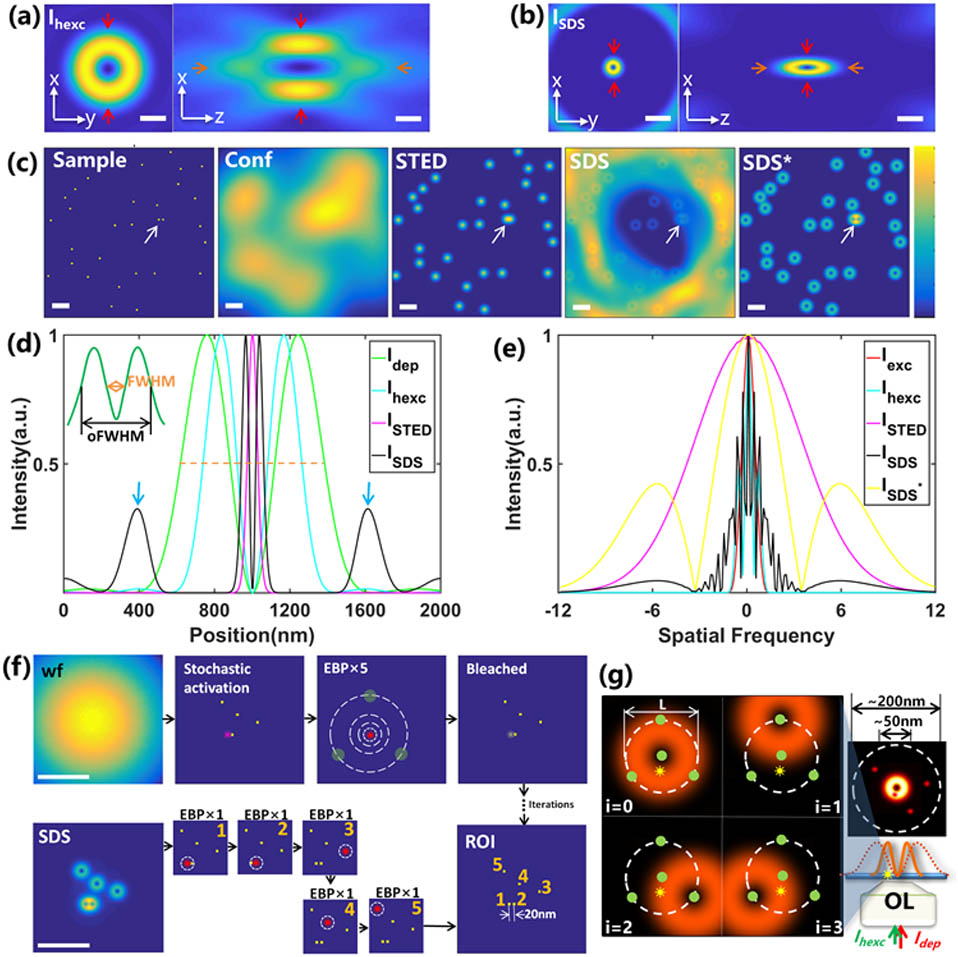
Fig. 1. (a) Lateral and axial PSFs of 3D diffraction-limited dark spot of hollow excitation beam (I hexc I exc , I STED I SDS 2 μm × 2 μm I dep I STED I SDS I exc , I hexc , I STED I SDS 2 π NA / λ N A : 1.4 ; λ : 532 nm I exc : 10 kW / cm 2 I hexc : 10 kW / cm 2 I dep : 5 MW / cm 2 50 – 100 MW / cm 2
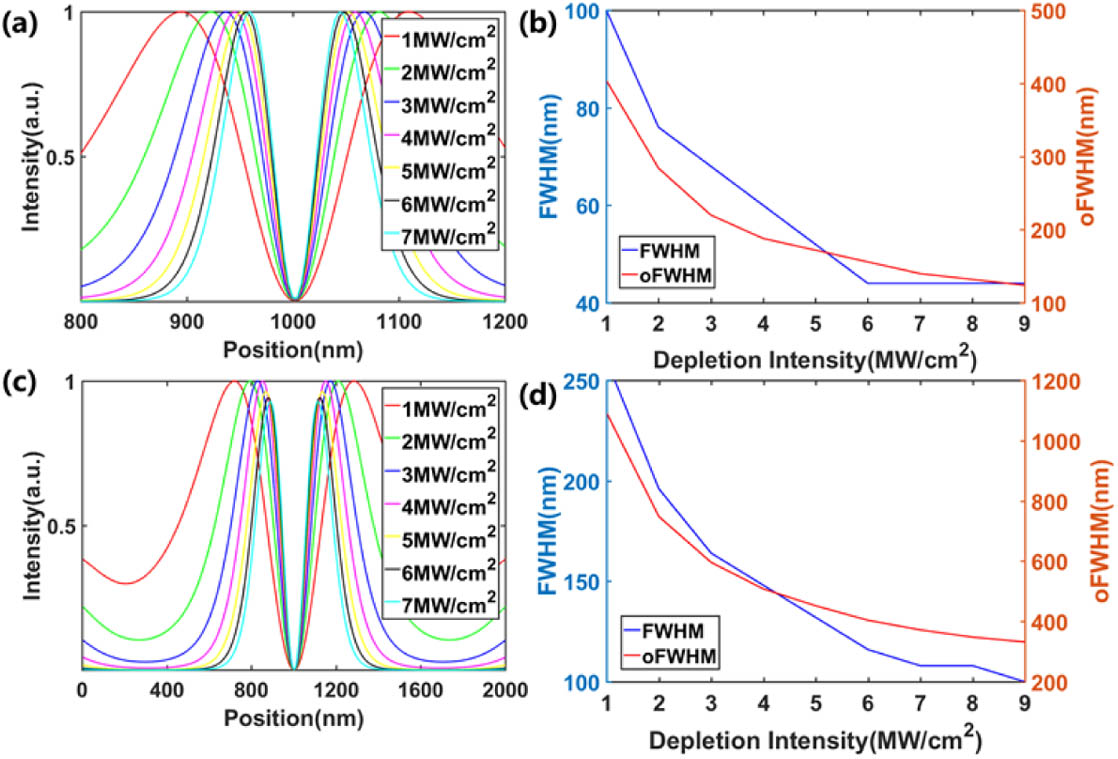
Fig. 2. PSFs of I SDS I dep I SDS I dep = 1 – 7 MW / cm 2 I dep I dep = 1 – 9 MW / cm 2 I SDS I dep = 1 – 7 MW / cm 2 I dep I dep = 1 – 9 MW / cm 2
Fig. 3. (a) CRB values in the lateral localization for the origin of the lateral detection circle when L x y = 4 – 20 nm N = 50 – 350 X Y X Y L x y = 20 nm N = 50 SBR = 30 L z = 4 – 20 nm N = 50 – 35 Z Z L z = 20 nm N = 50 – 350 SBR = 30 I dep = 30 MW / cm 2 N = 50
Fig. 4. (a) Lateral CRB comparison (in the origin of the detection circle) between different sizes of SDS: oFWHM of ∼ 50 nm ∼ 100 nm ∼ 150 nm ∼ 200 nm L = 10 – 40 nm N = 50 L = 10 – 40 nm N = 50 X Y X Y X Z
Fig. 5. (a) Localization results of SDLM on the 3D letter “A” shaped map. The photon number is 200 in those simulations while L = 20 nm

Set citation alerts for the article
Please enter your email address
© Copyright 2018-2021 | Chinese Laser Press. All Rights Reserved 沪ICP备15018463号-20