
Gang Cheng, Zhenxue Wang, Honghu Zhu, Dongyan Li, Qian Ma. Research Review of Rock and Soil Deformation Monitoring Based on Distributed Fiber Optic Sensing[J]. Laser & Optoelectronics Progress, 2022, 59(19): 1900004
- Laser & Optoelectronics Progress
- Vol. 59, Issue 19, 1900004 (2022)
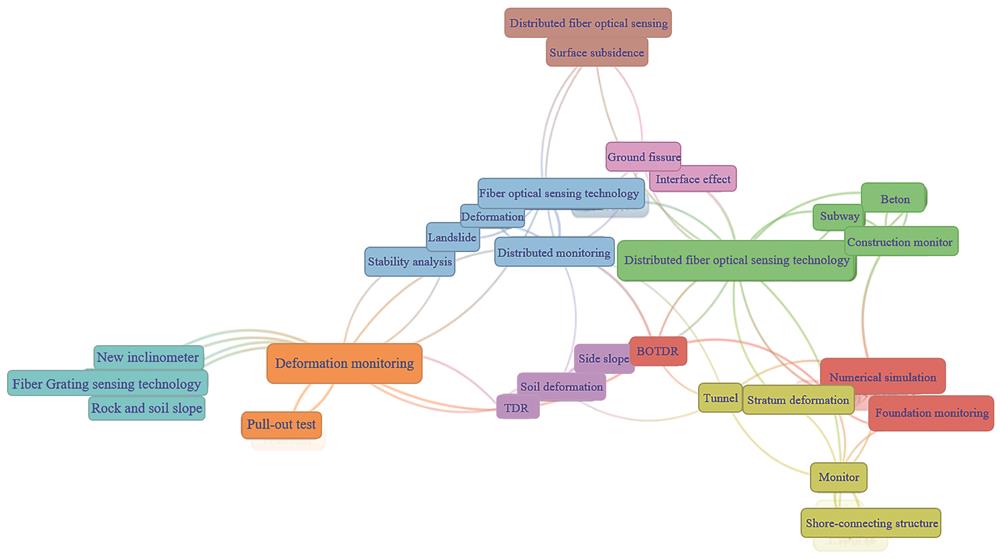
Fig. 1. High frequency keyword spectrum of rock and soil mass deformation monitoring
![Typical classification of DFOS[4]](/richHtml/lop/2022/59/19/1900004/img_02.jpg)
Fig. 2. Typical classification of DFOS[4]
Fig. 3. Measuring principle of FBG technology[16]
Fig. 4. Geotextiles embedded with nylon fiber optic[20]
Fig. 5. Measurement principle of BOTDR technology[22]
Fig. 6. Measurement principle of BOTDA technology [26]
Fig. 7. Measurement principle of BOFDA technology[28]
Fig. 8. Measurement principle of DAS technology[31]
Fig. 9. Principle of temperature self-compensation sensor[36]
Fig. 10. Refer to the fiber optic supplement method for fiber optic layout[18]
Fig. 11. BOTDR temperature-compensating fiber optic layout[40]
Fig. 12. Coupling process model of fiber-sand[45]
Fig. 13. Controlled pressure cable-rock and soil mass coupling test device[46]
Fig. 14. Attachment type layout technology. (a) Anchorage bolt and steel structure sticking arrangement method; (b) PHC pile grooves and concrete pre-embedded placement method[48]
Fig. 15. Embedded layout technology. (a) Excavation trench layout method; (b) borehole implantable layout method
Fig. 16. Slope engineering monitoring system based on fiber optic sensing technology[57]
Fig. 17. Flow chart of combined prediction model[59]
Fig. 18. Volute fiber optic layout scheme[62]
Fig. 19. Practical application of fiber optic sensing in tunnel[65]
Fig. 20. Monitoring type of shield tunnel[66]
Fig. 21. Subgrade collapse monitoring[71]
Fig. 22. Pipeline structure state monitoring and evaluation process[72]
Fig. 23. Fiber optic monitoring layout scheme for buried pipeline[74]
Fig. 24. Railway engineering monitoring scheme integrating DAS and AI[78]
| ||||||||||||||||||||
Table 1. Mini FBG sensor performance parameters
| ||||||||||||||||||||||||||||||||||||||||||||||||||||||||||
Table 2. Comparison of several typical fiber optic technical parameters and technical indicators of main commercial equipment

Set citation alerts for the article
Please enter your email address
© Copyright 2018-2021 | Chinese Laser Press. All Rights Reserved 沪ICP备15018463号-20