• Photonics Research
  • Vol. 8, Issue 7, 1064 (2020)
Bei-Bei Li1, George Brawley2, Hamish Greenall2, Stefan Forstner2, Eoin Sheridan2, Halina Rubinsztein-Dunlop2, and Warwick P. Bowen2、*
Author Affiliations
  • 1Institute of Physics, Chinese Academy of Sciences, Beijing 100190, China
  • 2School of Mathematics and Physics, The University of Queensland, St Lucia, QLD 4072, Australia
  • show less
    DOI: 10.1364/PRJ.390261 Cite this Article Set citation alerts
    Bei-Bei Li, George Brawley, Hamish Greenall, Stefan Forstner, Eoin Sheridan, Halina Rubinsztein-Dunlop, Warwick P. Bowen. Ultrabroadband and sensitive cavity optomechanical magnetometry[J]. Photonics Research, 2020, 8(7): 1064 Copy Citation Text show less
    (a)–(c) Optical microscope images showing the Terfenol-D deposition process. (d) and (e) The SEM images of a microtoroid before and after the Terfenol-D deposition. The scale bar in (d) is 40 μm. (f) A schematic of the side view of a magnetometer, with a principal radius of R, minor diameter of d, and a pedestal width of Wped. (g)–(i) Top view optical microscope images of a fabricated magnetometer, with gradually decreased pedestal width, marked in the area between the two white dotted circles.
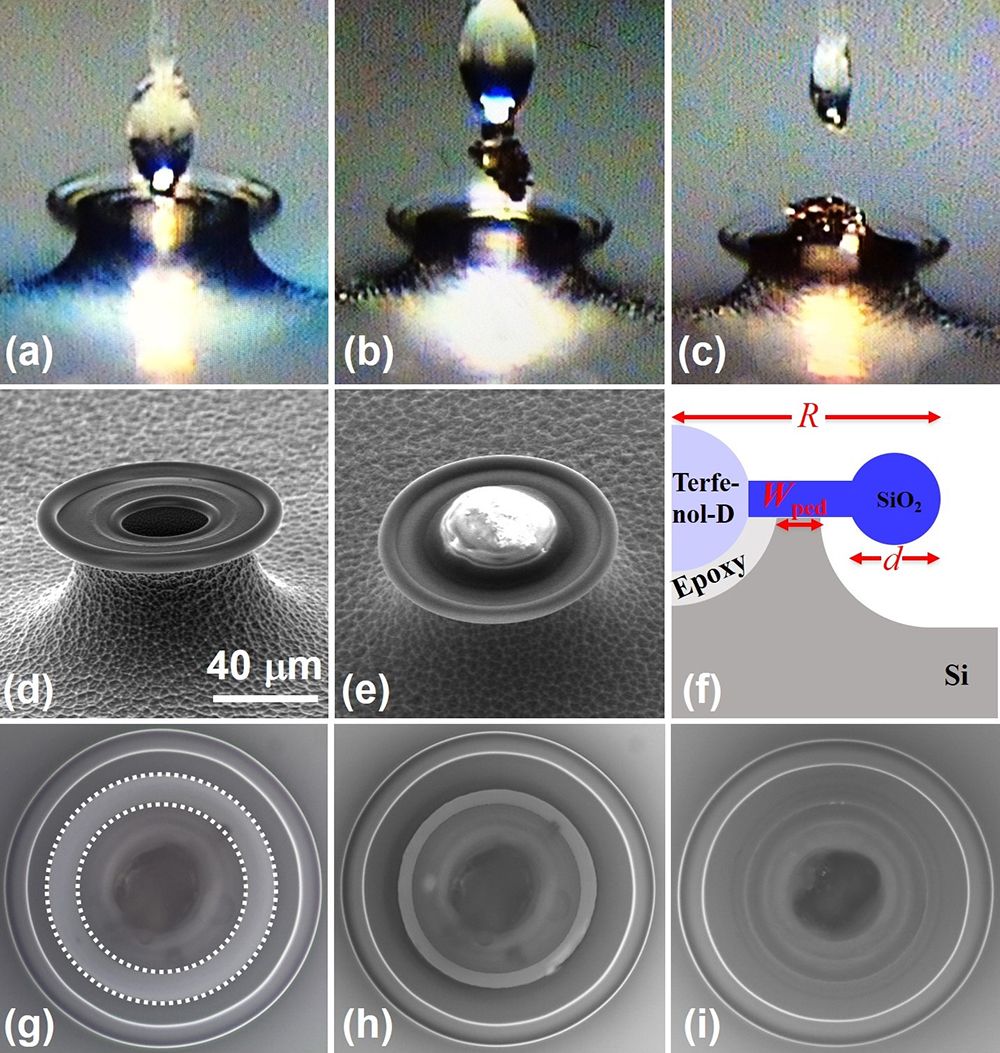
    Fig. 1. (a)–(c) Optical microscope images showing the Terfenol-D deposition process. (d) and (e) The SEM images of a microtoroid before and after the Terfenol-D deposition. The scale bar in (d) is 40 μm. (f) A schematic of the side view of a magnetometer, with a principal radius of R, minor diameter of d, and a pedestal width of Wped. (g)–(i) Top view optical microscope images of a fabricated magnetometer, with gradually decreased pedestal width, marked in the area between the two white dotted circles.
    Magnetic field sensitivity improvement by etching down the width of the silicon pedestal. (a) and (b) The noise power spectra and sensitivity spectra for a magnetometer with pedestal width of 4.5 μm (red curve) and 0.5 μm (black curve). (c) The peak sensitivity frequency and (d) peak sensitivity of the magnetometer, as a function of the pedestal width.
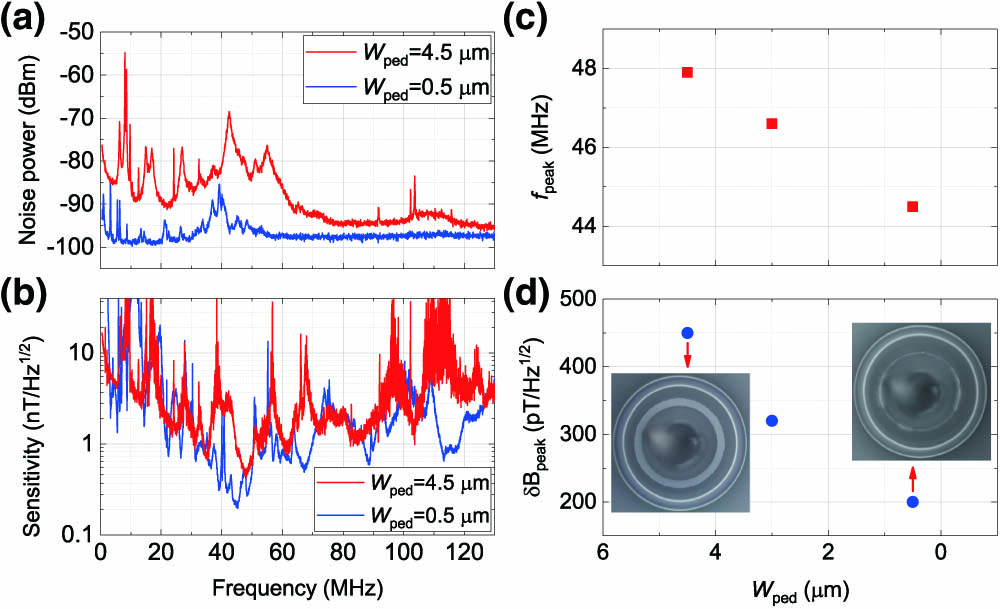
    Fig. 2. Magnetic field sensitivity improvement by etching down the width of the silicon pedestal. (a) and (b) The noise power spectra and sensitivity spectra for a magnetometer with pedestal width of 4.5 μm (red curve) and 0.5 μm (black curve). (c) The peak sensitivity frequency and (d) peak sensitivity of the magnetometer, as a function of the pedestal width.
    Measurement results for the two types of magnetometers. (a)–(c) The noise power spectrum, system response, and sensitivity spectrum for a Type I magnetometer. The inset of (c) shows the profile of the radial breathing mode (where the peak sensitivity occurs) of the magnetometer, obtained through finite element method simulation using COMSOL Multiphysics. (d)–(f) The corresponding results for a Type II magnetometer. The peak sensitivities are 44 pT/Hz and 26 pT/Hz for the Type I magnetometer and the Type II magnetometer, respectively.
    Fig. 3. Measurement results for the two types of magnetometers. (a)–(c) The noise power spectrum, system response, and sensitivity spectrum for a Type I magnetometer. The inset of (c) shows the profile of the radial breathing mode (where the peak sensitivity occurs) of the magnetometer, obtained through finite element method simulation using COMSOL Multiphysics. (d)–(f) The corresponding results for a Type II magnetometer. The peak sensitivities are 44  pT/Hz and 26  pT/Hz for the Type I magnetometer and the Type II magnetometer, respectively.
    Zoom-in on (a) the system response and (b) the sensitivity spectrum of the Type II magnetometer around its peak sensitivity frequency. The peak sensitivity is around 26 pT/Hz.
    Fig. 4. Zoom-in on (a) the system response and (b) the sensitivity spectrum of the Type II magnetometer around its peak sensitivity frequency. The peak sensitivity is around 26  pT/Hz.
    Measured peak sensitivities of 26 magnetometers, eighteen of which show Type I magnetic response (red squares) and eight show Type II magnetic response (blue circles).
    Fig. 5. Measured peak sensitivities of 26 magnetometers, eighteen of which show Type I magnetic response (red squares) and eight show Type II magnetic response (blue circles).
    (a) and (b) Measured amplitude and phase of the magnetic response in the frequency range between 32 MHz and 37 MHz, for a Type II magnetometer (No. 26 in Fig. 5). (c) and (d) Theoretically generated amplitude and phase of the system response obtained from the interference of multiple waves from different sources with different amplitudes and phases.
    Fig. 6. (a) and (b) Measured amplitude and phase of the magnetic response in the frequency range between 32 MHz and 37 MHz, for a Type II magnetometer (No. 26 in Fig. 5). (c) and (d) Theoretically generated amplitude and phase of the system response obtained from the interference of multiple waves from different sources with different amplitudes and phases.
    Accumulated bandwidth as a function of the threshold sensitivity for the Type I (black curve, device No. 25 in Fig. 5) and the Type II (red curve, device No. 9 in Fig. 5) magnetometers in Fig. 3. The 3 dB bandwidths for the Type I and Type II magnetometers are 11.3 MHz and 120 kHz, respectively. In the inset, it shows the definition of the accumulated bandwidth to be the total frequency range in the shaded area.
    Fig. 7. Accumulated bandwidth as a function of the threshold sensitivity for the Type I (black curve, device No. 25 in Fig. 5) and the Type II (red curve, device No. 9 in Fig. 5) magnetometers in Fig. 3. The 3 dB bandwidths for the Type I and Type II magnetometers are 11.3 MHz and 120 kHz, respectively. In the inset, it shows the definition of the accumulated bandwidth to be the total frequency range in the shaded area.
    (a) Magnetic response for different DC magnetic fields applied to the magnetometer, in the frequency range between 32 and 37 MHz, for a Type II magnetometer (No. 26 in Fig. 5). (b) Theoretically predicted response obtained from the interference of multiple wave components with different amplitudes and phases, with varied relative amplitudes of the different wave components, which simulates the effect of changing DC magnetic fields applied to the magnetometer.
    Fig. 8. (a) Magnetic response for different DC magnetic fields applied to the magnetometer, in the frequency range between 32 and 37 MHz, for a Type II magnetometer (No. 26 in Fig. 5). (b) Theoretically predicted response obtained from the interference of multiple wave components with different amplitudes and phases, with varied relative amplitudes of the different wave components, which simulates the effect of changing DC magnetic fields applied to the magnetometer.
    Bei-Bei Li, George Brawley, Hamish Greenall, Stefan Forstner, Eoin Sheridan, Halina Rubinsztein-Dunlop, Warwick P. Bowen. Ultrabroadband and sensitive cavity optomechanical magnetometry[J]. Photonics Research, 2020, 8(7): 1064
    Download Citation