• Photonics Research
  • Vol. 8, Issue 5, 642 (2020)
Shaohua Gao1、2, Jiayi Wang1, Wenhua Li1, Xuanyi Yu1, Xinzheng Zhang1、3、7、*, Xiao Song1, Andrey Iljin4、8、*, Irena Drevensek-Olenik5, Romano A. Rupp1、6, and Jingjun Xu1、3、9、*
Author Affiliations
  • 1The MOE Key Laboratory of Weak-Light Nonlinear Photonics, TEDA Institute of Applied Physics and School of Physics, Nankai University, Tianjin 300457, China
  • 2Institute of Optoelectronic Engineering, College of Physics & Optoelectronics, Taiyuan University of Technology, Taiyuan 030024, China
  • 3Synergetic Innovation Center of Chemical Science and Engineering, Tianjin 300071, China
  • 4Institute of Physics, National Academy of Sciences of Ukraine, Prospect Nauki 46, Kiev 03028, Ukraine
  • 5Faculty of Mathematics and Physics, University of Ljubljana and Department of Complex Matter, J. Stefan Institute, Ljubljana, Slovenia
  • 6Faculty of Physics, Vienna University, Boltzmanngasse 5, A-1090 Wien, Austria
  • 7e-mail: zxz@nankai.edu.cn
  • 8e-mail: lgtc@iop.kiev.ua
  • 9e-mail: jjxu@nankai.edu.cn
  • show less
    DOI: 10.1364/PRJ.388706 Cite this Article Set citation alerts
    Shaohua Gao, Jiayi Wang, Wenhua Li, Xuanyi Yu, Xinzheng Zhang, Xiao Song, Andrey Iljin, Irena Drevensek-Olenik, Romano A. Rupp, Jingjun Xu. Low threshold random lasing in dye-doped and strongly disordered chiral liquid crystals[J]. Photonics Research, 2020, 8(5): 642 Copy Citation Text show less
    Sketch of the experimental setup.
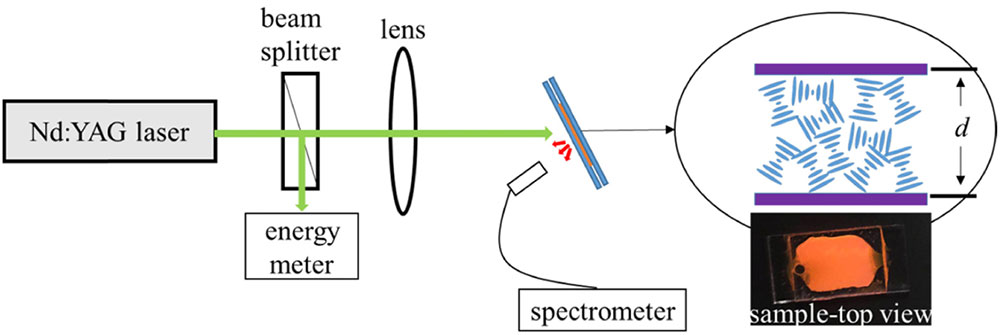
    Fig. 1. Sketch of the experimental setup.
    (a) Reflection spectra and (b) transmission spectra for dye-doped planarly oriented CLC samples with different concentrations of the chiral agent CB15. The black solid curve is the fluorescence spectrum of PM597.
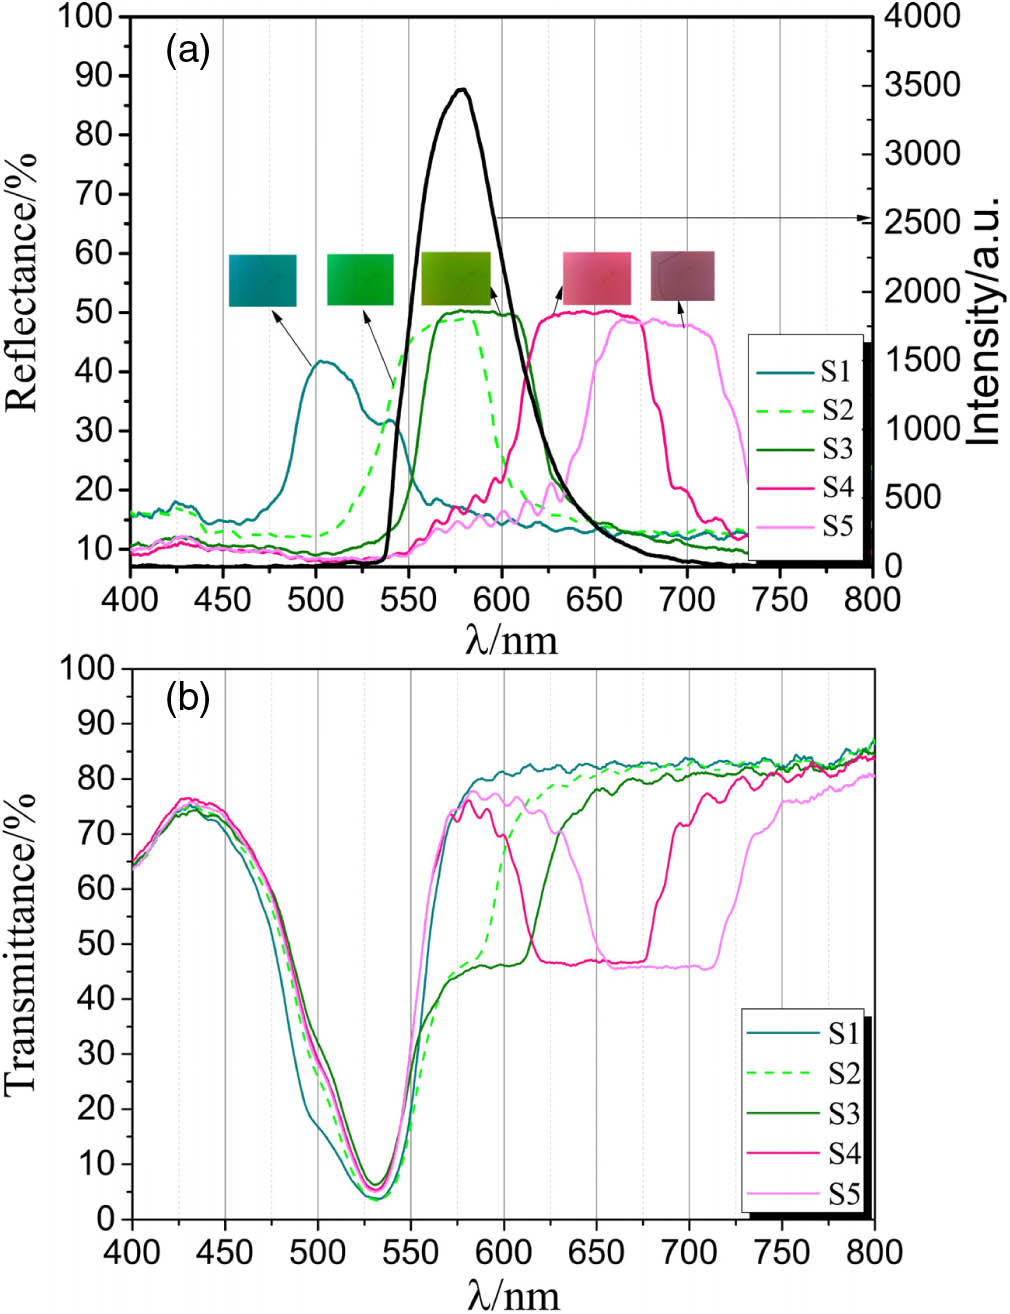
    Fig. 2. (a) Reflection spectra and (b) transmission spectra for dye-doped planarly oriented CLC samples with different concentrations of the chiral agent CB15. The black solid curve is the fluorescence spectrum of PM597.
    Texture patterns of samples with different concentrations of the chiral agent CB15 in nonoriented cells observed by a POM with a 20× objective. (a) S1*, (b) S2*, (c) S3*, (d) S4*, (e) S5* in reflection mode. (f)–(j) Corresponding textures in transmission mode. All cell gaps are 230 μm.
    Fig. 3. Texture patterns of samples with different concentrations of the chiral agent CB15 in nonoriented cells observed by a POM with a 20× objective. (a) S1*, (b) S2*, (c) S3*, (d) S4*, (e) S5* in reflection mode. (f)–(j) Corresponding textures in transmission mode. All cell gaps are 230 μm.
    Spectra (a)–(e) represent emission for different disordered samples S1*, S2*, S3*, S4*, S5*, respectively. (f) The dependence of the peak intensities of the random lasing on the pump energy for different concentrations of the chiral agent. The black lines in spectra (g)–(k) are the emission spectra corresponding to spectra (a)–(e); the red lines in spectra (g)–(k) are reflection spectra for oriented CLC samples, respectively.
    Fig. 4. Spectra (a)–(e) represent emission for different disordered samples S1*, S2*, S3*, S4*, S5*, respectively. (f) The dependence of the peak intensities of the random lasing on the pump energy for different concentrations of the chiral agent. The black lines in spectra (g)–(k) are the emission spectra corresponding to spectra (a)–(e); the red lines in spectra (g)–(k) are reflection spectra for oriented CLC samples, respectively.
    (a) Emission spectra for different pump positions across the sample S2*. (b) Emission spectra of the sample S2* for different single-pump shots.
    Fig. 5. (a) Emission spectra for different pump positions across the sample S2*. (b) Emission spectra of the sample S2* for different single-pump shots.
    Working mechanism of RL in a dye-doped CLC random system with a selective reflection band (a) coinciding with the fluorescence peak and (b) far away from the fluorescence peak. The yellow arrows represent the scattering light beams at the wavelength of the fluorescent peak. The helical axes of microdomains designated by red arrows exhibit a small angle with the direction of the incident light, which results in enhanced reflective behavior when the selective reflection band of the sample overlaps with the fluorescence peak of the dye. The dark and light yellow arrows represent strong and weak feedback, respectively.
    Fig. 6. Working mechanism of RL in a dye-doped CLC random system with a selective reflection band (a) coinciding with the fluorescence peak and (b) far away from the fluorescence peak. The yellow arrows represent the scattering light beams at the wavelength of the fluorescent peak. The helical axes of microdomains designated by red arrows exhibit a small angle with the direction of the incident light, which results in enhanced reflective behavior when the selective reflection band of the sample overlaps with the fluorescence peak of the dye. The dark and light yellow arrows represent strong and weak feedback, respectively.
    Shaohua Gao, Jiayi Wang, Wenhua Li, Xuanyi Yu, Xinzheng Zhang, Xiao Song, Andrey Iljin, Irena Drevensek-Olenik, Romano A. Rupp, Jingjun Xu. Low threshold random lasing in dye-doped and strongly disordered chiral liquid crystals[J]. Photonics Research, 2020, 8(5): 642
    Download Citation