• Acta Optica Sinica
  • Vol. 38, Issue 5, 0501002 (2018)
Shiwei Bai1、2、1; 2; , Gang Sun、1*; *; , Xuebin Li1、1; , Qing Liu1、2、1; 2; , and Ningquan Weng1、3、1; 3;
Author Affiliations
  • 1 Key Laboratory of Atmospheric Optics, Anhui Institute of Optics and Fine Mechanics, Chinese Academy of Sciences, Hefei, Anhui 230031, China
  • 2 Science Island Branch of Graduate School, University of Science and Technology of China, Hefei, Anhui 230031, China
  • 3 School of Environmental Science and Optoelectronic Technology, University of Science and Technology of China, Hefei, Anhui 230026, China
  • show less
    DOI: 10.3788/AOS201838.0501002 Cite this Article Set citation alerts
    Shiwei Bai, Gang Sun, Xuebin Li, Qing Liu, Ningquan Weng. Application of Wavelet Analysis in Research of Near-Surface Turbulence Coherent Structure[J]. Acta Optica Sinica, 2018, 38(5): 0501002 Copy Citation Text show less
    Time scale map of wavelet coefficient of F(t)
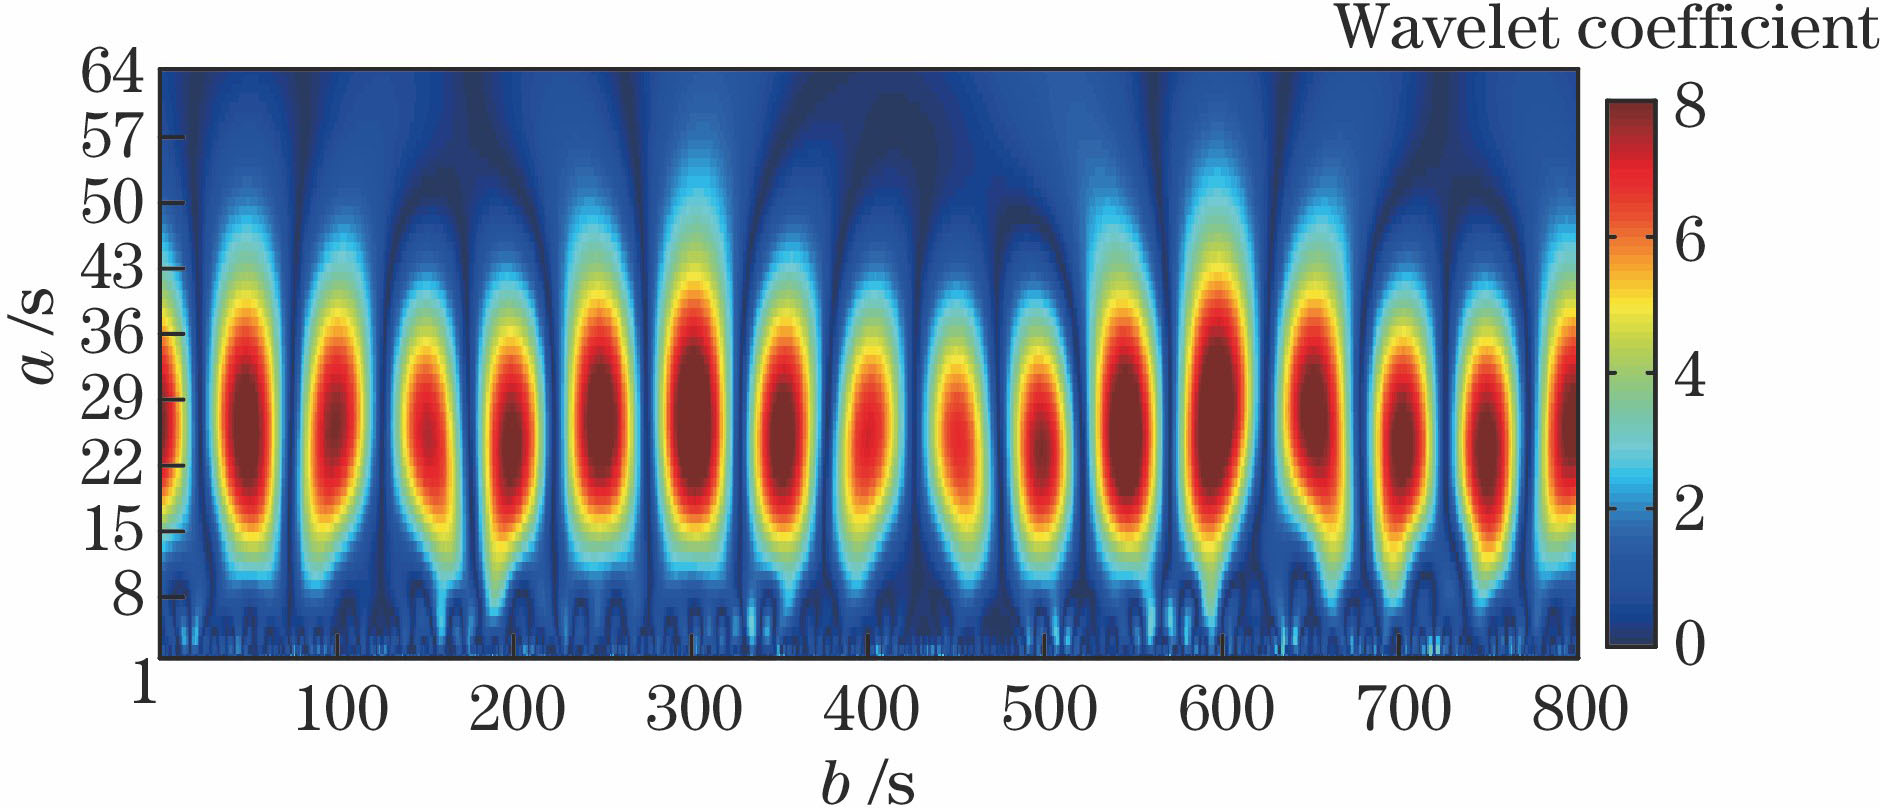
    Fig. 1. Time scale map of wavelet coefficient of F(t)
    Wavelet energy diagram of F(t)
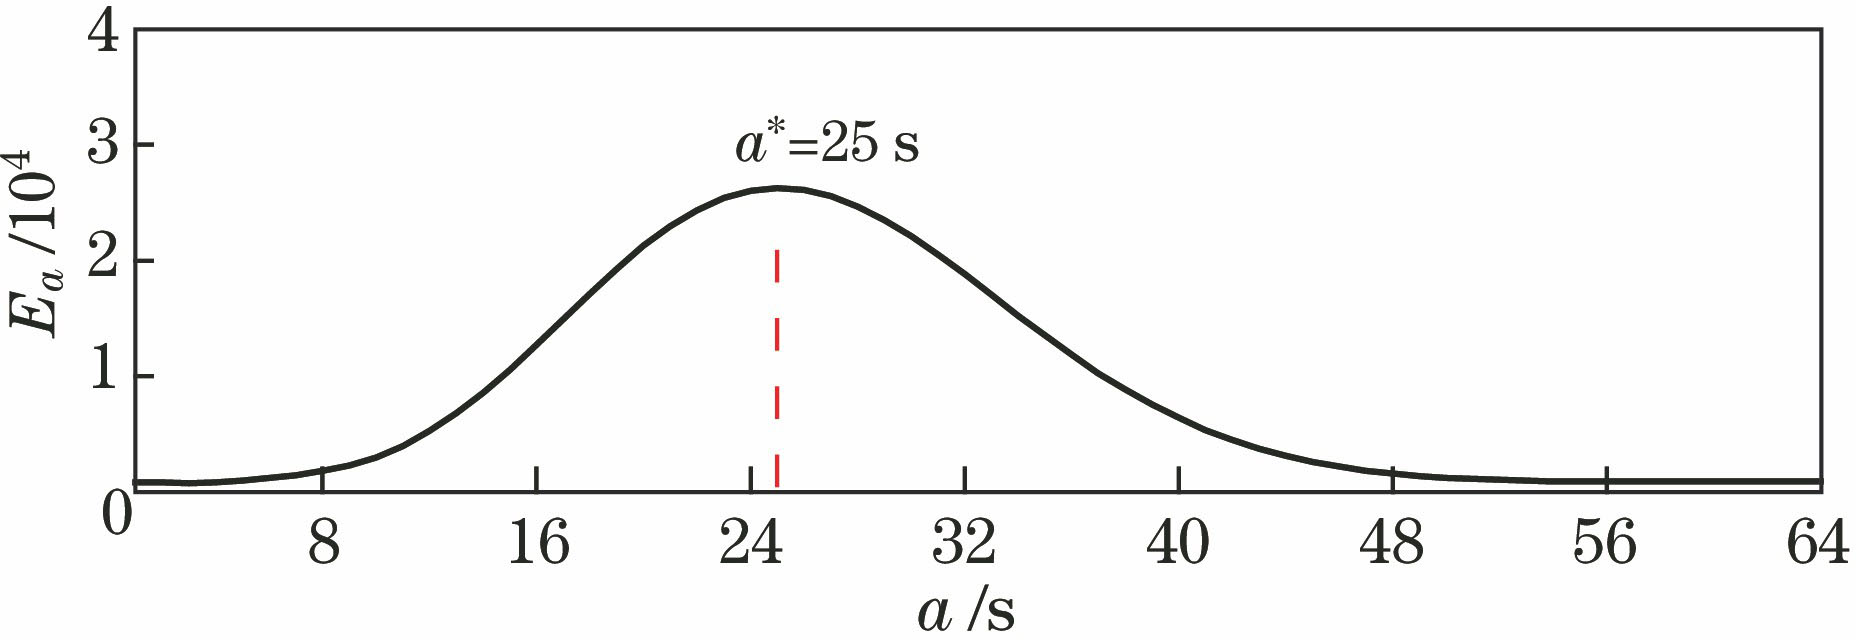
    Fig. 2. Wavelet energy diagram of F(t)
    (a) Comparison of F(t) and f(a*,t); (b) comparison of f(t) and f(a*,t)
    Fig. 3. (a) Comparison of F(t) and f(a*,t); (b) comparison of f(t) and f(a*,t)
    (a) Time scale map of wavelet coefficient of U1; (b) time series of U1
    Fig. 4. (a) Time scale map of wavelet coefficient of U1; (b) time series of U1
    Time scale map of wavelet coefficient of wind velocity fluctuation. (a) V1; (b) W1
    Fig. 5. Time scale map of wavelet coefficient of wind velocity fluctuation. (a) V1; (b) W1
    Wavelet energy curves of three-dimensional wind velocity fluctuation. (a) U1; (b) V1; (c) W1
    Fig. 6. Wavelet energy curves of three-dimensional wind velocity fluctuation. (a) U1; (b) V1; (c) W1
    Comparison of wind velocity fluctuation signal and coherent waveform signal. (a) U1; (b) V1; (c) W1
    Fig. 7. Comparison of wind velocity fluctuation signal and coherent waveform signal. (a) U1; (b) V1; (c) W1
    Probability distributions of reconstructed deviation. (a) ΔU1; (b) ΔV1; (c) ΔW1
    Fig. 8. Probability distributions of reconstructed deviation. (a) ΔU1; (b) ΔV1; (c) ΔW1
    Comparison of power spectra of wind velocity fluctuation and coherent signals. (a) U1; (b) V1; (c) W1
    Fig. 9. Comparison of power spectra of wind velocity fluctuation and coherent signals. (a) U1; (b) V1; (c) W1
    Probability distributions of coherent structure at different scales. (a) U1; (b) V1; (c) W1
    Fig. 10. Probability distributions of coherent structure at different scales. (a) U1; (b) V1; (c) W1
    Probability distribution of period and scale ratio of coherent structure
    Fig. 11. Probability distribution of period and scale ratio of coherent structure
    Shiwei Bai, Gang Sun, Xuebin Li, Qing Liu, Ningquan Weng. Application of Wavelet Analysis in Research of Near-Surface Turbulence Coherent Structure[J]. Acta Optica Sinica, 2018, 38(5): 0501002
    Download Citation