• Acta Photonica Sinica
  • Vol. 50, Issue 9, 0912002 (2021)
Yaqin SUN, Fan WANG, Jin YU, Ang ZHANG, Can ZHANG, Yuzhuo ZHANG, Nan GAO, Zhaozong MENG, and Zonghua ZHANG
Author Affiliations
  • School of Mechanical Engineering, Hebei University of Technology, Tianjin300130China
  • show less
    DOI: 10.3788/gzxb20215009.0912002 Cite this Article
    Yaqin SUN, Fan WANG, Jin YU, Ang ZHANG, Can ZHANG, Yuzhuo ZHANG, Nan GAO, Zhaozong MENG, Zonghua ZHANG. Distortion Measurement and Correction of Projector Based on Phase Target[J]. Acta Photonica Sinica, 2021, 50(9): 0912002 Copy Citation Text show less
    Logical block diagram of measuring distortion of full-field image
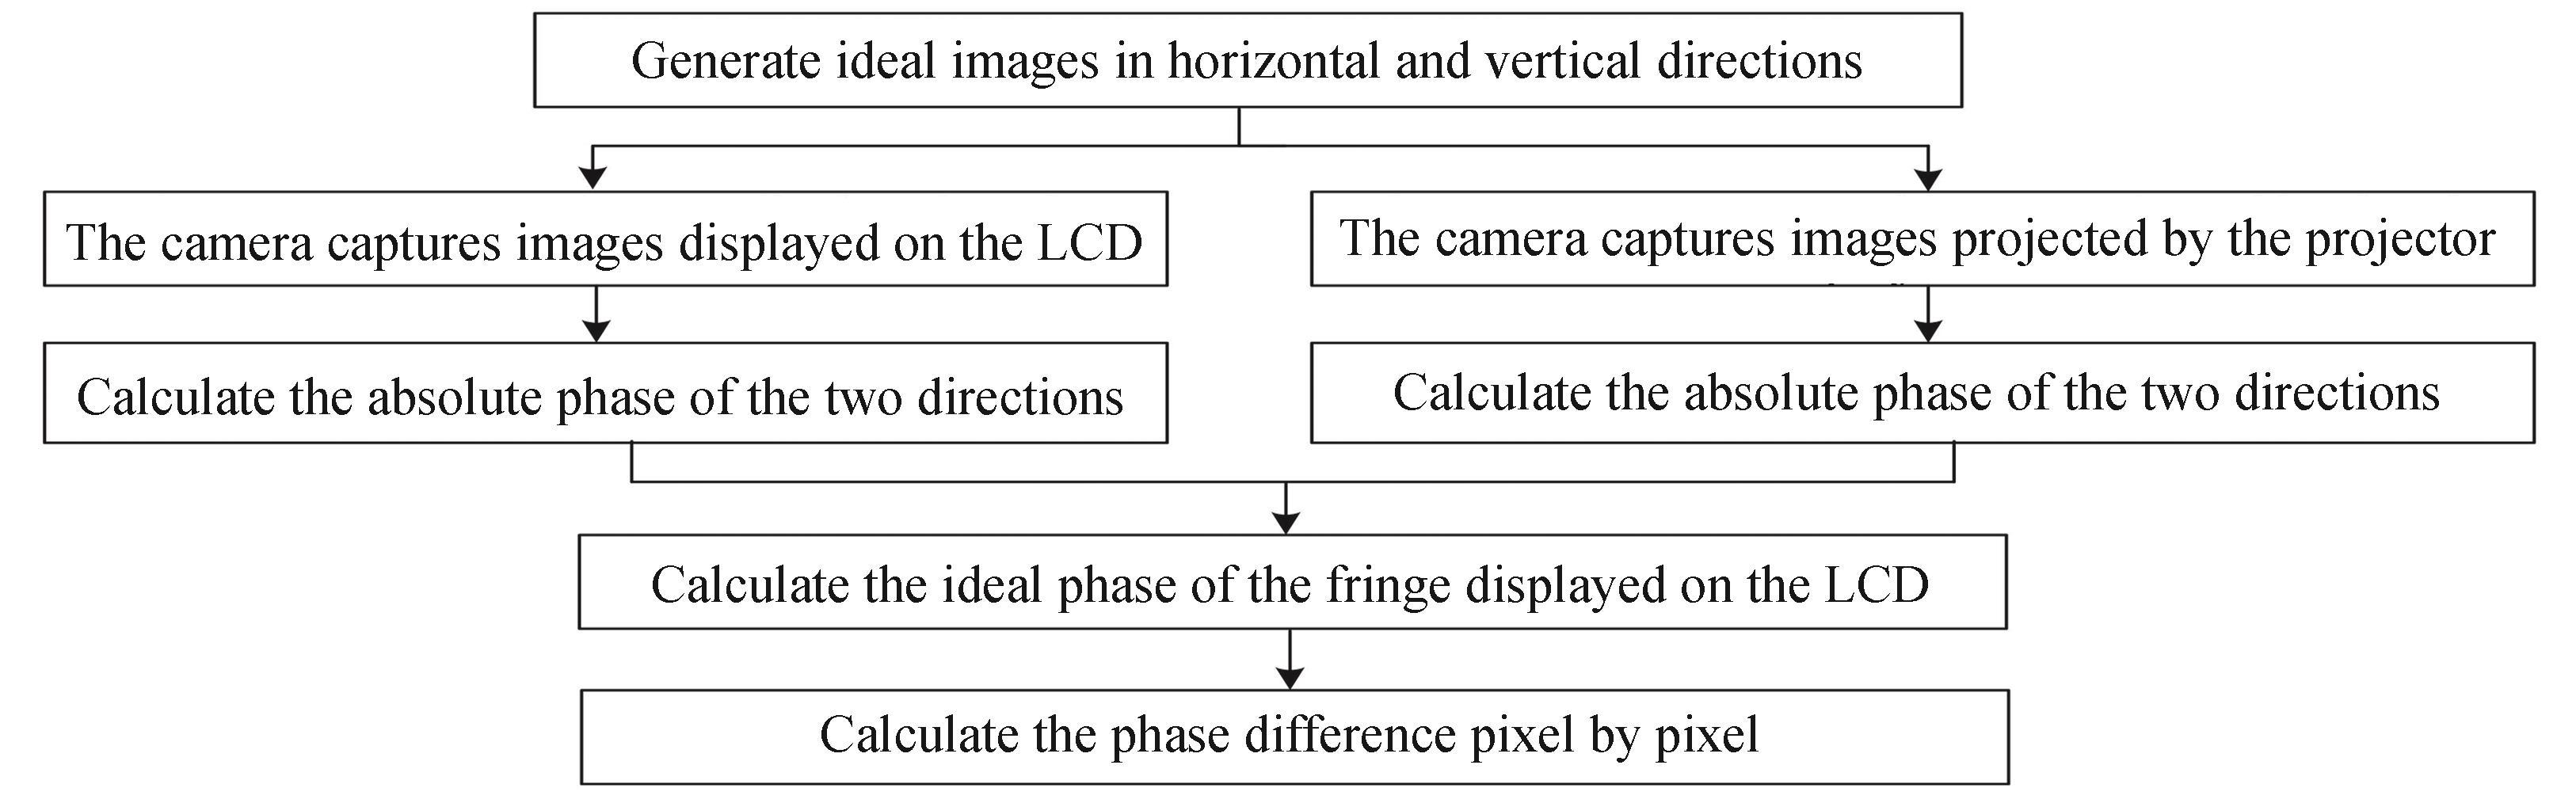
    Fig. 1. Logical block diagram of measuring distortion of full-field image
    Relationship between actual LCD display phase and ideal LCD display phase
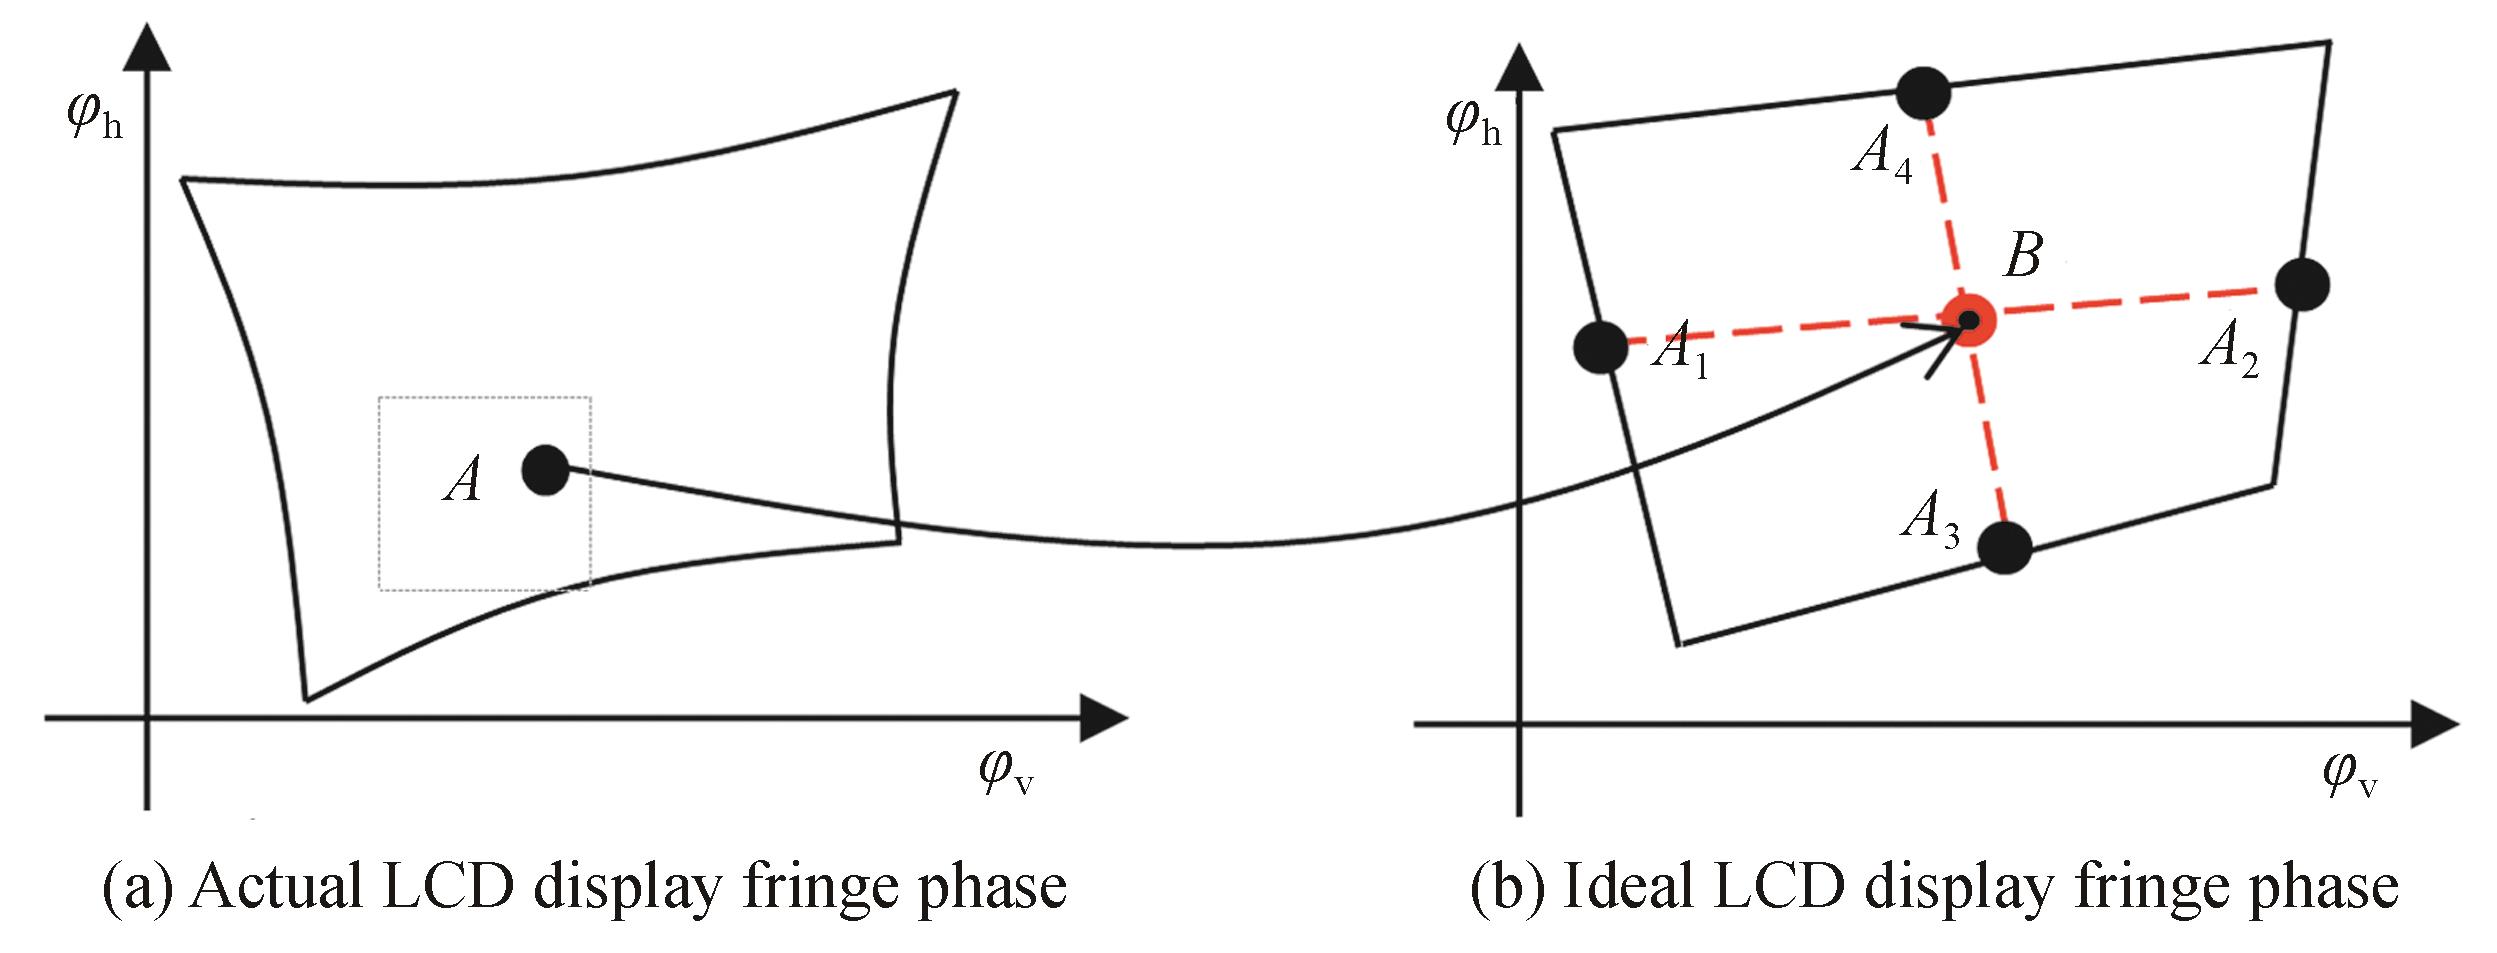
    Fig. 2. Relationship between actual LCD display phase and ideal LCD display phase
    Flow chart for establishing mathematical model of ideal LCD display phase
    Fig. 3. Flow chart for establishing mathematical model of ideal LCD display phase
    Distortion calibration process
    Fig. 4. Distortion calibration process
    Distortion correction flow
    Fig. 5. Distortion correction flow
    Relationship of actual LCD display phase, ideal LCD display phase and LCD reflection phase
    Fig. 6. Relationship of actual LCD display phase, ideal LCD display phase and LCD reflection phase
    Calculating compensation phase flow
    Fig. 7. Calculating compensation phase flow
    Schematic diagram of brightness matching
    Fig. 8. Schematic diagram of brightness matching
    Brightness matching flow
    Fig. 9. Brightness matching flow
    Experimental system
    Fig. 10. Experimental system
    Absolute phase diagram
    Fig. 11. Absolute phase diagram
    Schematic of the distortion calibration result of the projector
    Fig. 12. Schematic of the distortion calibration result of the projector
    Schematic of closed frame distortion
    Fig. 13. Schematic of closed frame distortion
    Pre-compensated fringe image
    Fig. 14. Pre-compensated fringe image
    Schematic diagram of the change of the closed rectangle before and after pre-compensation in the LCD self-display phase
    Fig. 15. Schematic diagram of the change of the closed rectangle before and after pre-compensation in the LCD self-display phase
    3D topography restoration map of the step
    Fig. 16. 3D topography restoration map of the step
    The sum of squares due to errorRoot mean squared errorCoefficient of determination
    Before compensation3.327×10-64.2410.997 7
    After compensation1.374×10-63.2080.998 2
    Table 1. Fitting parameters of the horizontal fringe expansion phase plane
    The sum of squares due to errorRoot mean squared errorCoefficient of determination
    Before compensation3.638×10-64.4360.997 4
    After compensation9.972×10-62.7380.998 6
    Table 2. Fitting parameters of the vertical fringe expansion phase plane
    Standard valueBefore compensationAfter compensationError before compensationError after compensation
    Step1 and Step218.42219.14918.4910.7270.069
    Step2 and Step313.25812.53713.163-0.721-0.095
    Table 3. Measurement accuracy of the distance between the step surface before and after calibration
    Yaqin SUN, Fan WANG, Jin YU, Ang ZHANG, Can ZHANG, Yuzhuo ZHANG, Nan GAO, Zhaozong MENG, Zonghua ZHANG. Distortion Measurement and Correction of Projector Based on Phase Target[J]. Acta Photonica Sinica, 2021, 50(9): 0912002
    Download Citation