• Acta Optica Sinica
  • Vol. 40, Issue 21, 2131001 (2020)
Gang Chen1、3, Dingquan Liu1、2、3、*, Chong Ma1, Kaixuan Wang1、2, Li Zhang1, and Lingshan Gao1、3
Author Affiliations
  • 1Shanghai Institute of Technical Physics, Chinese Academy of Sciences, Shanghai 200083, China
  • 2School of Physical Science and Technology, ShanghaiTech University, Shanghai 200031, China
  • 3University of Chinese Academy of Sciences, Beijing 100049, China
  • show less
    DOI: 10.3788/AOS202040.2131001 Cite this Article Set citation alerts
    Gang Chen, Dingquan Liu, Chong Ma, Kaixuan Wang, Li Zhang, Lingshan Gao. Optical Spectra and Surface Morphologies of Near-Infrared Narrow Band-Pass Filters Using Dual Ion Beam Sputtering[J]. Acta Optica Sinica, 2020, 40(21): 2131001 Copy Citation Text show less
    Spectral constant curves of Nb2O5 and SiO2 thin films. (a) Refractive index n; (b) extinction coefficients k
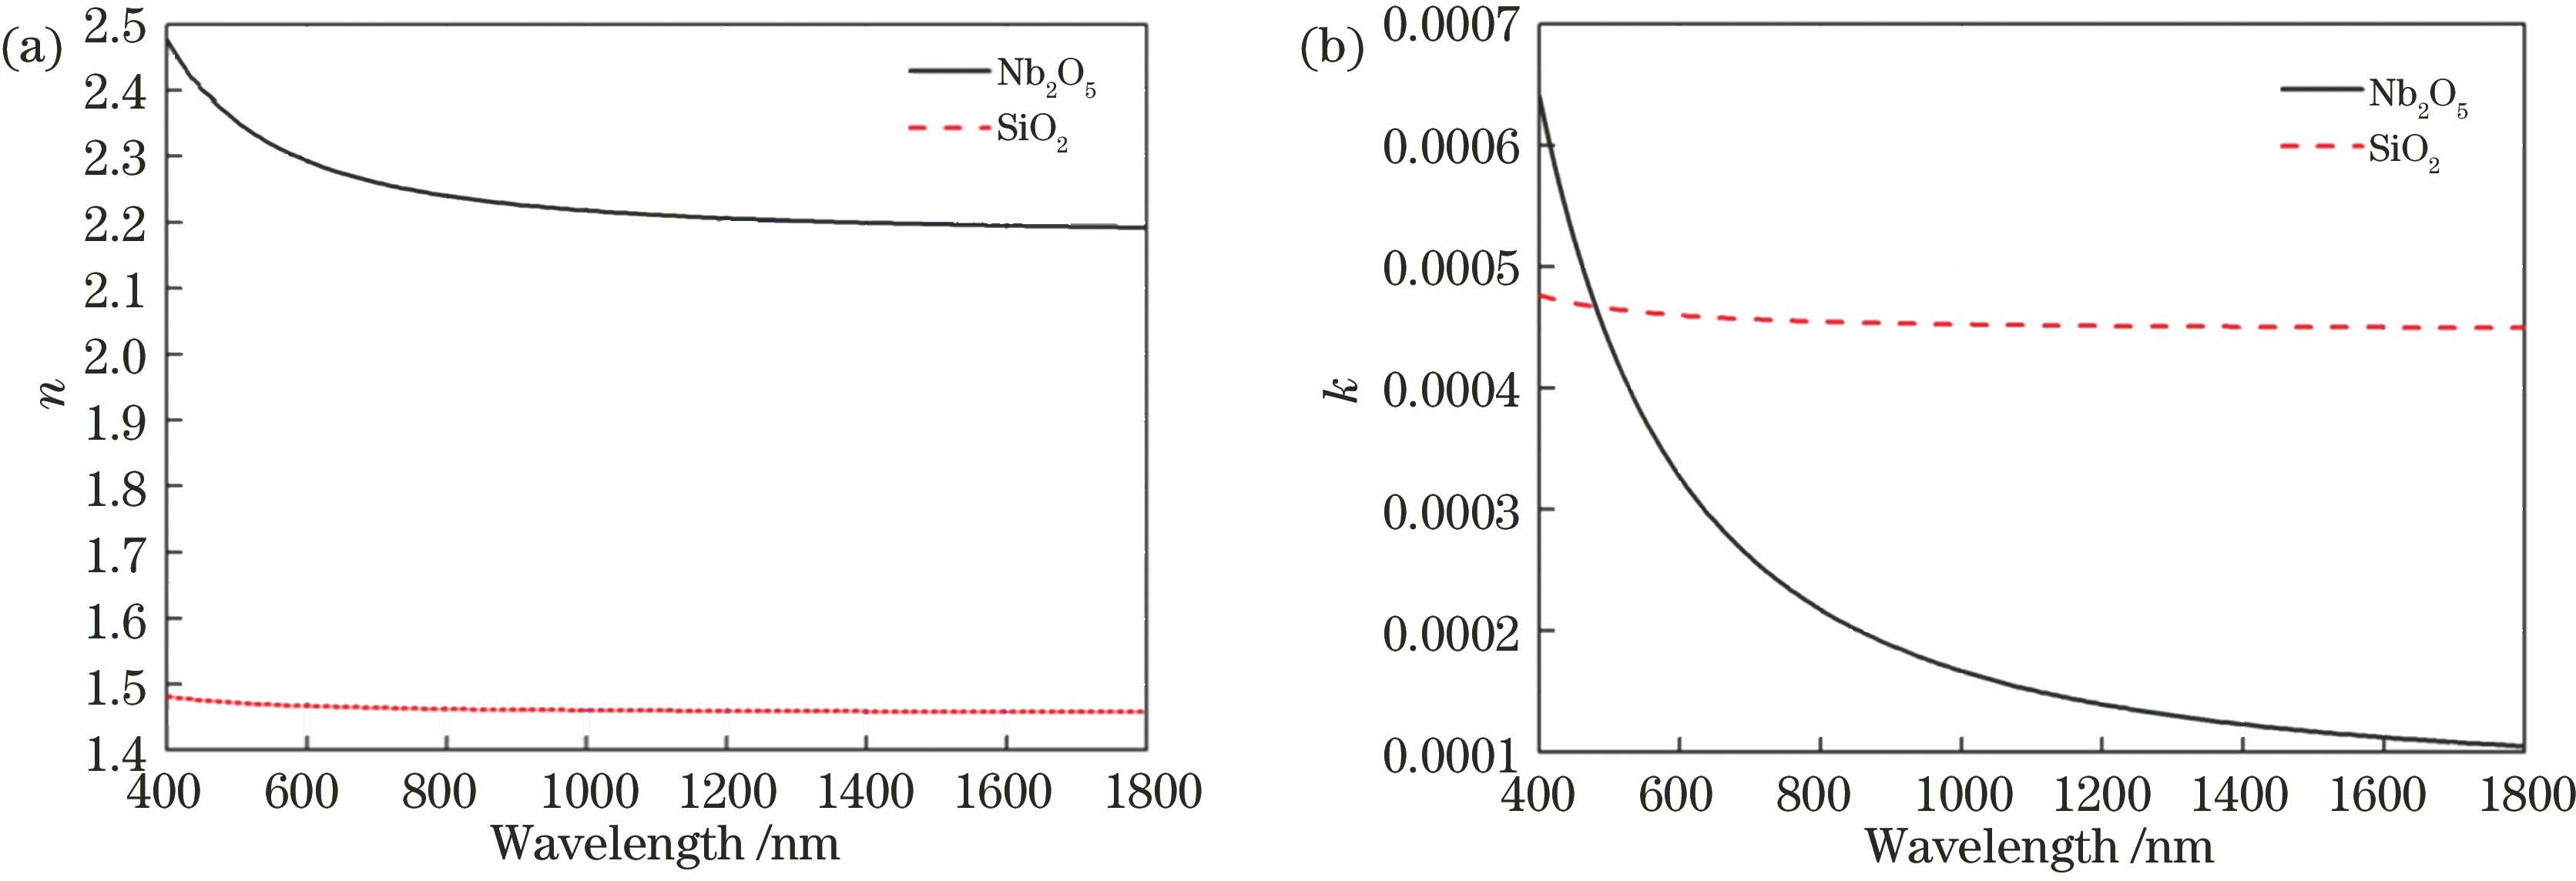
    Fig. 1. Spectral constant curves of Nb2O5 and SiO2 thin films. (a) Refractive index n; (b) extinction coefficients k
    Designed transmittance curves of two filters. (a) 1375 nm channel; (b) 1610 nm channel
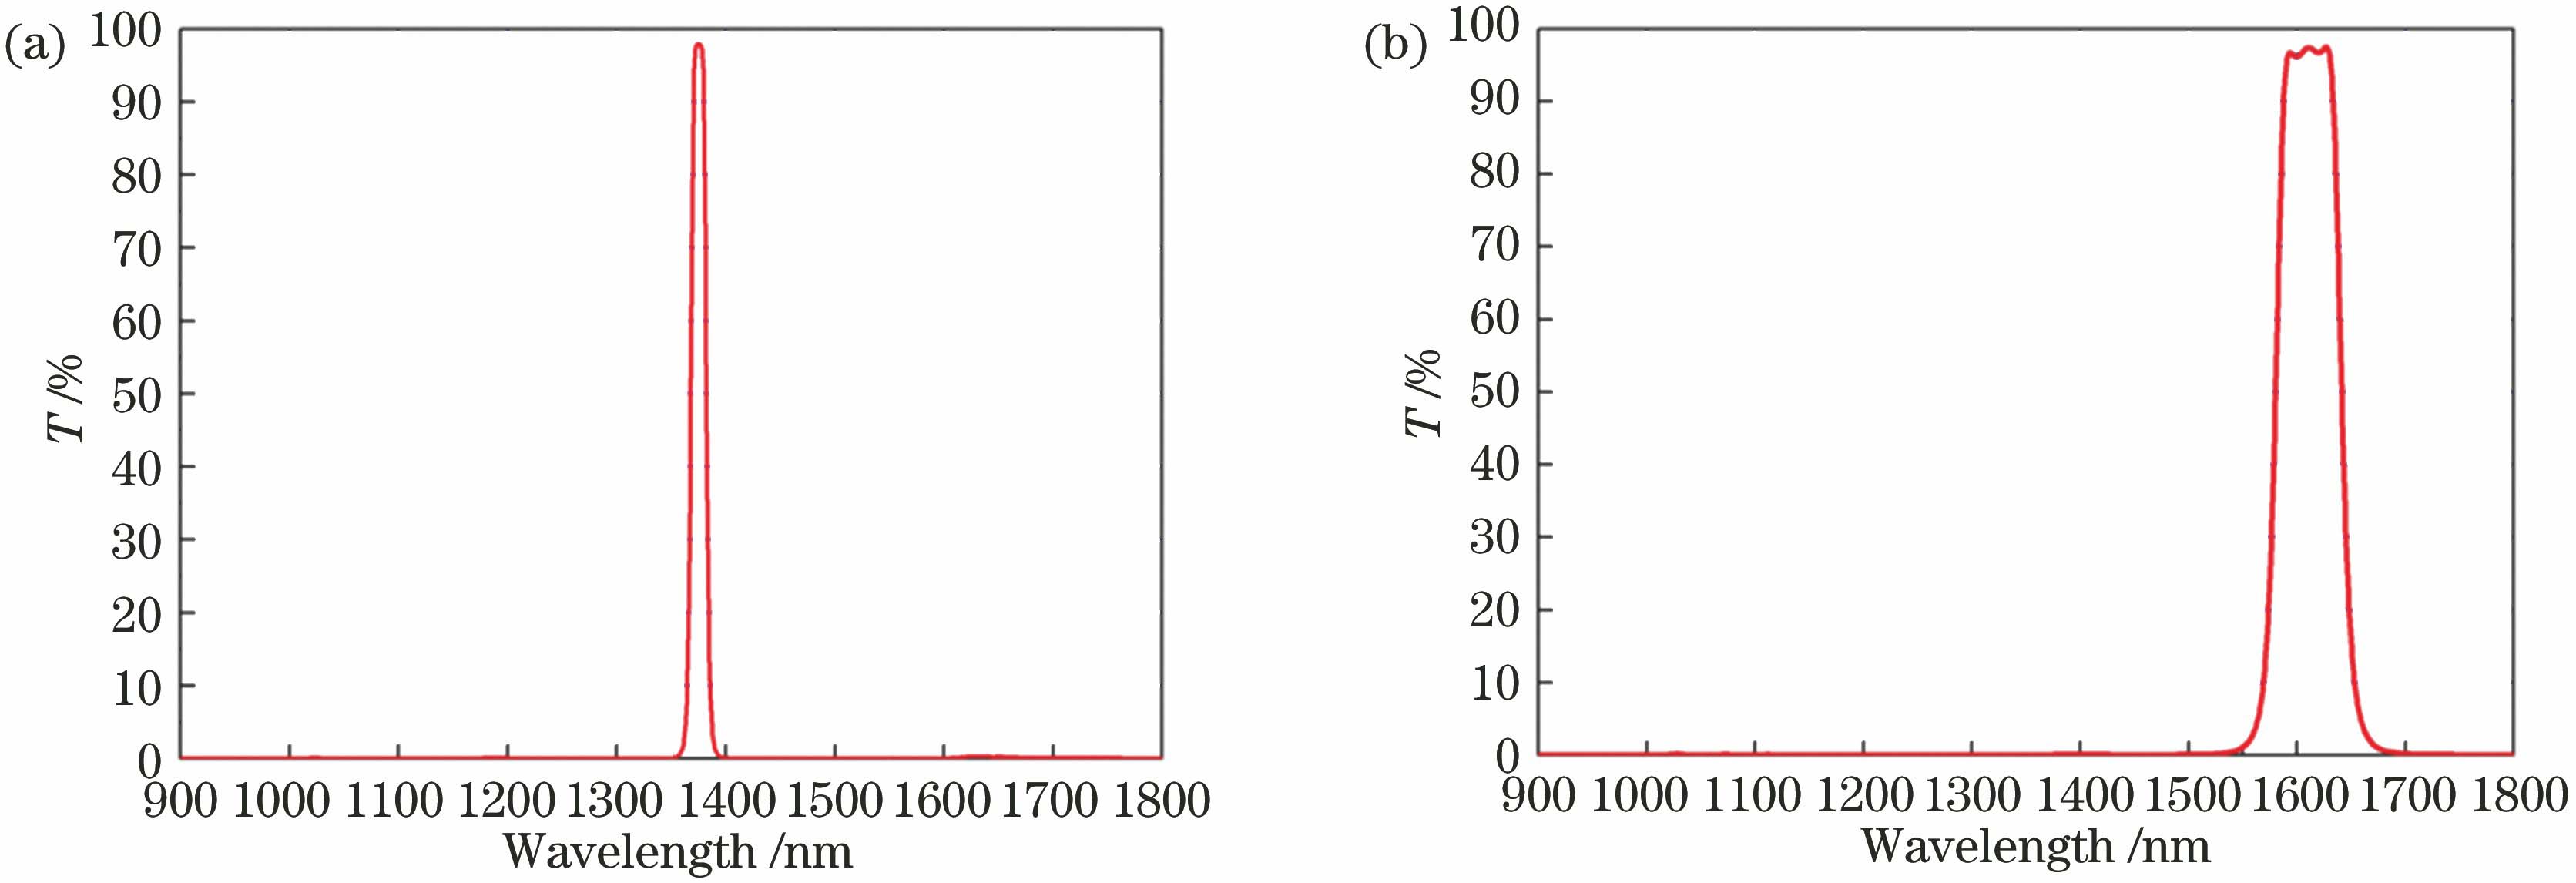
    Fig. 2. Designed transmittance curves of two filters. (a) 1375 nm channel; (b) 1610 nm channel
    Schematic DIBS experimental setup
    Fig. 3. Schematic DIBS experimental setup
    Designed and tested optical transmittance curves of 1375 nm filter. (a) Test range of 900-1800 nm;(b) test range of 1350-1400 nm
    Fig. 4. Designed and tested optical transmittance curves of 1375 nm filter. (a) Test range of 900-1800 nm;(b) test range of 1350-1400 nm
    Designed and tested transmittance curves of 1610 nm filter. (a) Test range of 900-1800 nm; (b) test range of 1520-1700 nm
    Fig. 5. Designed and tested transmittance curves of 1610 nm filter. (a) Test range of 900-1800 nm; (b) test range of 1520-1700 nm
    Optical microscope images of the surface of filter prepared by IBAD. (a) 1610 nm channel; (b) 1375 nm channel
    Fig. 6. Optical microscope images of the surface of filter prepared by IBAD. (a) 1610 nm channel; (b) 1375 nm channel
    AFM images of the surface of filter prepared by IBAD. (a) 1610 nm channel; (b) 1375 nm channel
    Fig. 7. AFM images of the surface of filter prepared by IBAD. (a) 1610 nm channel; (b) 1375 nm channel
    Optical images of the surface of filter prepared by DIBS. (a) 1610 nm channel; (b) 1375 nm channel
    Fig. 8. Optical images of the surface of filter prepared by DIBS. (a) 1610 nm channel; (b) 1375 nm channel
    AFM images of the surface of filter prepared by DIBS. (a) 1610 nm channel; (b) 1375 nm channel
    Fig. 9. AFM images of the surface of filter prepared by DIBS. (a) 1610 nm channel; (b) 1375 nm channel
    Output electric signals of detector after coupling with filters. (a) 1375 nm channel; (b) 1610 nm channel
    Fig. 10. Output electric signals of detector after coupling with filters. (a) 1375 nm channel; (b) 1610 nm channel
    TargetRF16RF12Deposition rate /(nm·s-1 )
    Voltage /VCurrent /mAFlow /(mL·min-1)Voltage /VCurrent /mAFlow /(mL·min-1)
    Nb125060018(Ar)4001503(Ar),12(O2)0.27
    SiO2125060018(Ar)400753(Ar),12(O2)0.21
    Table 1. Relevant parameters for preparing filters using DIBS technology
    Surface roughnessIBADDIBS
    1375 nm1610 nm1375 nm1610 nm
    Max /nm449.28868.404.853.90
    Min /nm-315.38-96.80-5.06-3.19
    Peak-to-peak /nm764.66965.219.917.09
    Root-mean-square /nm78.2538.340.810.57
    Table 2. Surface roughness of filters prepared by IBAD and DIBS
    Gang Chen, Dingquan Liu, Chong Ma, Kaixuan Wang, Li Zhang, Lingshan Gao. Optical Spectra and Surface Morphologies of Near-Infrared Narrow Band-Pass Filters Using Dual Ion Beam Sputtering[J]. Acta Optica Sinica, 2020, 40(21): 2131001
    Download Citation