
Ran Li, Wanrong Gao, Yifeng Tang. Main Factor Analysis for Imaging Performance of Hand-Held Full-Field Optical Coherence Tomography System with Dual Interferometers[J]. Laser & Optoelectronics Progress, 2023, 60(12): 1217002
- Laser & Optoelectronics Progress
- Vol. 60, Issue 12, 1217002 (2023)
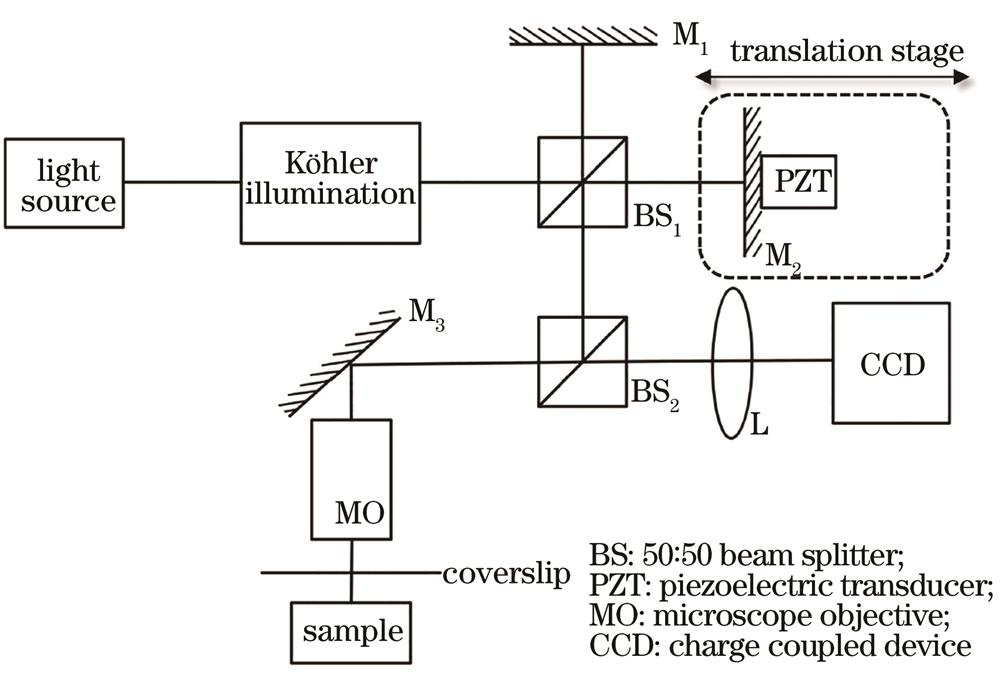
Fig. 1. Schematic of FFOCT system
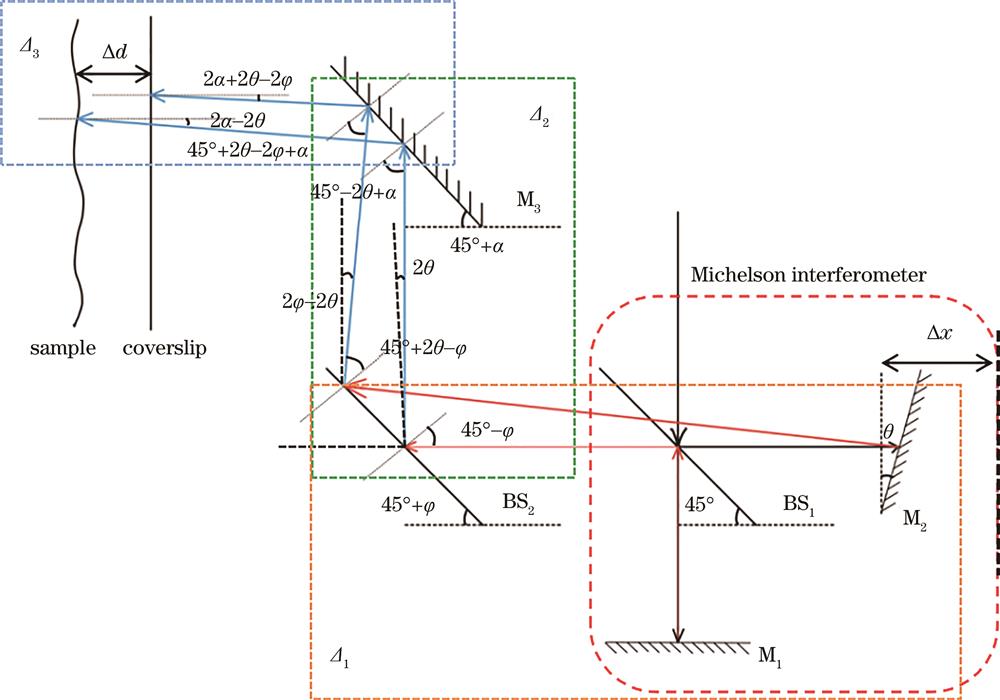
Fig. 2. Schematic of the optical path of the system when the mirror M3, beam splitter BS2, and plane mirror M2 have orientation deviation
Fig. 3. Schematic of orientation deviation analysis of Michelson interferometer part
Fig. 4. Schematic of orientation deviation analysis from the second beam splitter to the mirror
Fig. 5. Schematic of partial orientation deviation analysis between sample and mirror
Fig. 6. Schematic of system light path when only the mirror M3 has an orientation deviation
Fig. 7. Influence of the orientation deviation of the mirror M3. (a) Change of system visibility with the increase of imaging depth under different orientation deviations; (b) change of system visibility with the increase of mirror orientation deviation at different imaging depths
Fig. 8. Relationship between the compensation range and the orientation deviation at different imaging depths. (a) ∆d=1 μm; (b) ∆d=5 μm; (c) ∆d=10 μm
Fig. 9. Imaging of onions. (a) Microscopic image of onion surface; (b)-(d) en face images of onion at depths of 0, 10, 15 µm, respectively
| |||||||||||||||||||||||||||||||||||||||||||||||||||||||||||||||||||||||||||||||||||
Table 1. Relation between the orientation deviation and relative error that between the maximum and minimum value of the compensation range caused by the orientation deviation and the standard value at different imaging depths

Set citation alerts for the article
Please enter your email address
© Copyright 2018-2021 | Chinese Laser Press. All Rights Reserved 沪ICP备15018463号-20