• Journal of Semiconductors
  • Vol. 45, Issue 1, 012504 (2024)
Shunpeng Lu1、2, Jiangxiao Bai1、2, Hongbo Li1、2, Ke Jiang1、2, Jianwei Ben1、2, Shanli Zhang1、2, Zi-Hui Zhang1、3, Xiaojuan Sun1、2、*, and Dabing Li1、2、**
Author Affiliations
  • 1State Key Laboratory of Luminescence and Applications, Changchun Institute of Optics, Fine Mechanics and Physics, Chinese Academy of Sciences, Changchun 130033, China
  • 2Center of Materials Science and Optoelectronics Engineering, University of Chinese Academy of Sciences, Beijing 100049, China
  • 3Key Laboratory of Electronic Materials and Devices of Tianjin, School of Electronics and Information Engineering, Hebei University of Technology, Tianjin 300401, China
  • show less
    DOI: 10.1088/1674-4926/45/1/012504 Cite this Article
    Shunpeng Lu, Jiangxiao Bai, Hongbo Li, Ke Jiang, Jianwei Ben, Shanli Zhang, Zi-Hui Zhang, Xiaojuan Sun, Dabing Li. 240 nm AlGaN-based deep ultraviolet micro-LEDs: size effect versus edge effect[J]. Journal of Semiconductors, 2024, 45(1): 012504 Copy Citation Text show less
    (Color online) (a) Schematic diagram of the current distribution for the flip-chip structured micro-LEDs. (b) Schematic illustration of the epitaxial layers. Different sized micro-LEDs: R = (c) 12.5 μm, (d) 25.0 μm, and (e) 50.0 μm. (f) Spectrum of 12.5 μm sized micro-LEDs under various currents.
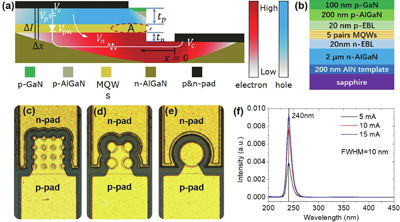
    Fig. 1. (Color online) (a) Schematic diagram of the current distribution for the flip-chip structured micro-LEDs. (b) Schematic illustration of the epitaxial layers. Different sized micro-LEDs: R = (c) 12.5 μm, (d) 25.0 μm, and (e) 50.0 μm. (f) Spectrum of 12.5 μm sized micro-LEDs under various currents.
    (Color online) SEM images of 12.5 μm size micro-LED (a) mesa and (b) cross section of the side-wall tilt angle. The inset within (b) is the schematic diagram of micro-LED 30° tilted side-wall light extraction. (c) Schematic diagram of 2D-FDTD simulation model for different sized micro-LEDs. Electric field distributions in the XY cross section of the TE-polarized light for (d) R = 50.0 μm , (e) 25.0 μm, and (f) 12.5 μm sized micro-LEDs, and TM-polarized light for (g) R = 50.0 μm , (h) 25.0 μm , and (i) 12.5 μm sized micro-LEDs.
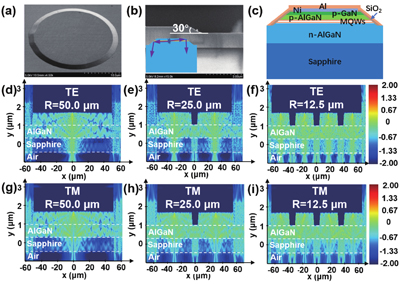
    Fig. 2. (Color online) SEM images of 12.5 μm size micro-LED (a) mesa and (b) cross section of the side-wall tilt angle. The inset within (b) is the schematic diagram of micro-LED 30° tilted side-wall light extraction. (c) Schematic diagram of 2D-FDTD simulation model for different sized micro-LEDs. Electric field distributions in the XY cross section of the TE-polarized light for (d) R = 50.0 μm , (e) 25.0 μm, and (f) 12.5 μm sized micro-LEDs, and TM-polarized light for (g) R = 50.0 μm , (h) 25.0 μm , and (i) 12.5 μm sized micro-LEDs.
    (Color online) (a) LEE-TE and (b) LEE-TM for different sized micro-LEDs based on FDTD numerical simulations.
    Fig. 3. (Color online) (a) LEE-TE and (b) LEE-TM for different sized micro-LEDs based on FDTD numerical simulations.
    (Color online) Optical output power and EQE for various sized micro-LEDs: (a) experimental results and (b) numerical simulation results.
    Fig. 4. (Color online) Optical output power and EQE for various sized micro-LEDs: (a) experimental results and (b) numerical simulation results.
    (Color online) Apsys simulation results of current density distribution along the MQWs for (a) 50.0 μm, (b) 25.0 μm, and (c)&(d) 12.5 μm sized micro-LEDs based on the model of Fig. 1(a). Here, compared to (c), (d) is closer to the n-electrode. (e) Wavelength−current relationship for different sized micro-LEDs.
    Fig. 5. (Color online) Apsys simulation results of current density distribution along the MQWs for (a) 50.0 μm, (b) 25.0 μm, and (c)&(d) 12.5 μm sized micro-LEDs based on the model of Fig. 1(a). Here, compared to (c), (d) is closer to the n-electrode. (e) Wavelength−current relationship for different sized micro-LEDs.
    (Color online) The current−voltage characteristics of different sized micro-LEDs: (a) experimental results, (b) numerical simulation results.
    Fig. 6. (Color online) The current−voltage characteristics of different sized micro-LEDs: (a) experimental results, (b) numerical simulation results.
    SizeR = 50 μm 1 × 1R = 25 μm 2 × 2R = 12.5 μm 4 × 4
    LEE_TM (%)3.855.6610.56
    LEE_TE (%)6.457.349.01
    Table 0. LEE for different sized micro-LEDs based on FDTD numerical simulations.
    SizeR = 50.0 μm 1 × 1R = 25.0 μm 2 × 2R = 12.5 μm 4 × 4
    Total mesa perimeter (μm)314.16628.321256.64
    P-contact area/mesa area (%)816436
    Table 0. Total mesa perimeter and p-contact area for different sized micro-LEDs.
    Shunpeng Lu, Jiangxiao Bai, Hongbo Li, Ke Jiang, Jianwei Ben, Shanli Zhang, Zi-Hui Zhang, Xiaojuan Sun, Dabing Li. 240 nm AlGaN-based deep ultraviolet micro-LEDs: size effect versus edge effect[J]. Journal of Semiconductors, 2024, 45(1): 012504
    Download Citation