
Xiangrui Meng, Changchun Chai, Fuxing Li, Yi Sun, Yintang Yang. High-power microwaves response characteristics of silicon and GaAs solar cells[J]. Journal of Semiconductors, 2022, 43(11): 112701
- Journal of Semiconductors
- Vol. 43, Issue 11, 112701 (2022)
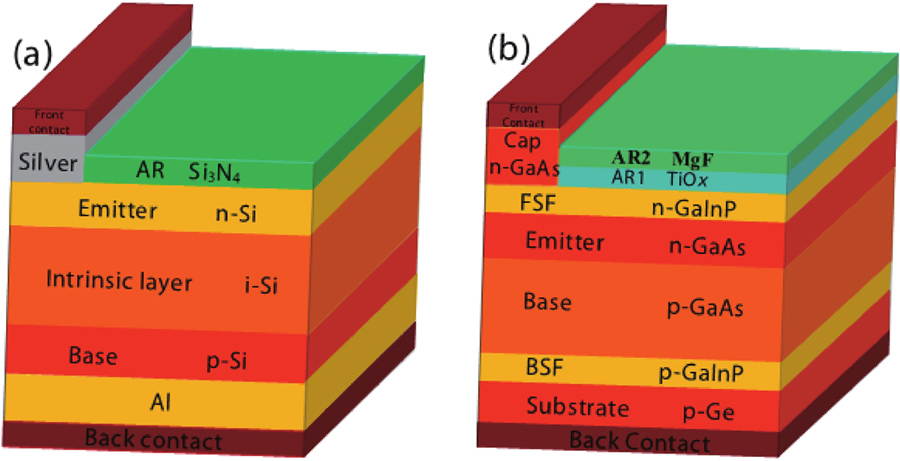
Fig. 1. (Color online) (a) Three-dimensional view of a single junction silicon solar cell. (b) Three-dimensional view of a single junction GaAs solar cell.
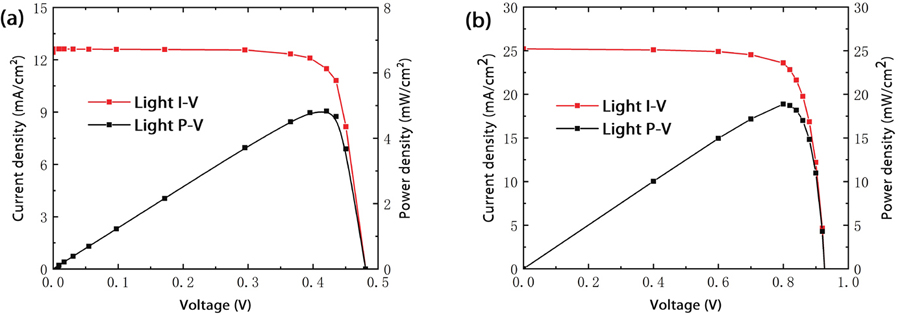
Fig. 2. (Color online) (a) The lightI–V andP–V characteristic curves of silicon solar cells. (b) The lightI–V andP–V characteristic curves of GaAs solar cells.
Fig. 3. (Color online) A silicon solar cell when it is burned out under injecting HPM with an amplitude of 270 V and frequency of 2 GHz. (a) Temperature distribution in the device. (b) The trend distribution of electric field intensity near the hot spot in the device.
Fig. 4. (Color online) The variation of HPM sinusoidal signal with time and the variation of peak temperature of Silicon solar cells under injecting this signal with time.
Fig. 5. (Color online) The variation of HPM sinusoidal signal with time and the variation of peak temperature of the silicon solar cell under injecting this signal with time.
Fig. 6. (Color online) The GaAs solar cell when it is burned out under injecting HPM with an amplitude of 270 V and frequency of 2 GHz. (a) Temperature distribution in the device. (b) The electric field intensity distribution of the device.
Fig. 7. (Color online) Under the injection of HPM with an amplitude of 270 V and frequency of 2 GHz. (a) The variation of HPM sinusoidal signal with time and the variation of peak temperature of the device with time. (b) The variation of current density with time in the device.
Fig. 8. (Color online) Actual variation and fitting variation of the burnout pulse width of the two kinds of solar cells with the voltage amplitude of HPM.
Fig. 9. (Color online) The variation of current density in the two kinds of solar cells under injecting HPM with an amplitude of 120 V and frequency of 5.8 GHz with time.
Fig. 10. (Color online) Variation of repetition frequency with different duty ratio with the injection time, variation of temperature of the two solar cells with time after injecting the signal. (a) Repetition frequency with duty ratio of 25%. (b) Repetition frequency with duty ratio of 75%.
Fig. 11. (Color online) Variation of repetition frequency with different carrier frequency with the injection time, variation of temperature of the two solar cells with time after injecting the signal. (a) Repetition frequency with carrier frequency of 2 GHz. (b) Repetition frequency with carrier frequency of 5 GHz.
| ||||||||||||||||||||||||||||||
Table 1. The details of the thickness (μm) of two kinds of solar cells.

Set citation alerts for the article
Please enter your email address
© Copyright 2018-2021 | Chinese Laser Press. All Rights Reserved 沪ICP备15018463号-20