
Bing Han, Guojun Li, Zejun Hu, Yisheng Zhang. Radiation Calibration of All-Sky Auroral Imager Based on Stellar Radiation Stability[J]. Acta Optica Sinica, 2021, 41(5): 0512004
- Acta Optica Sinica
- Vol. 41, Issue 5, 0512004 (2021)
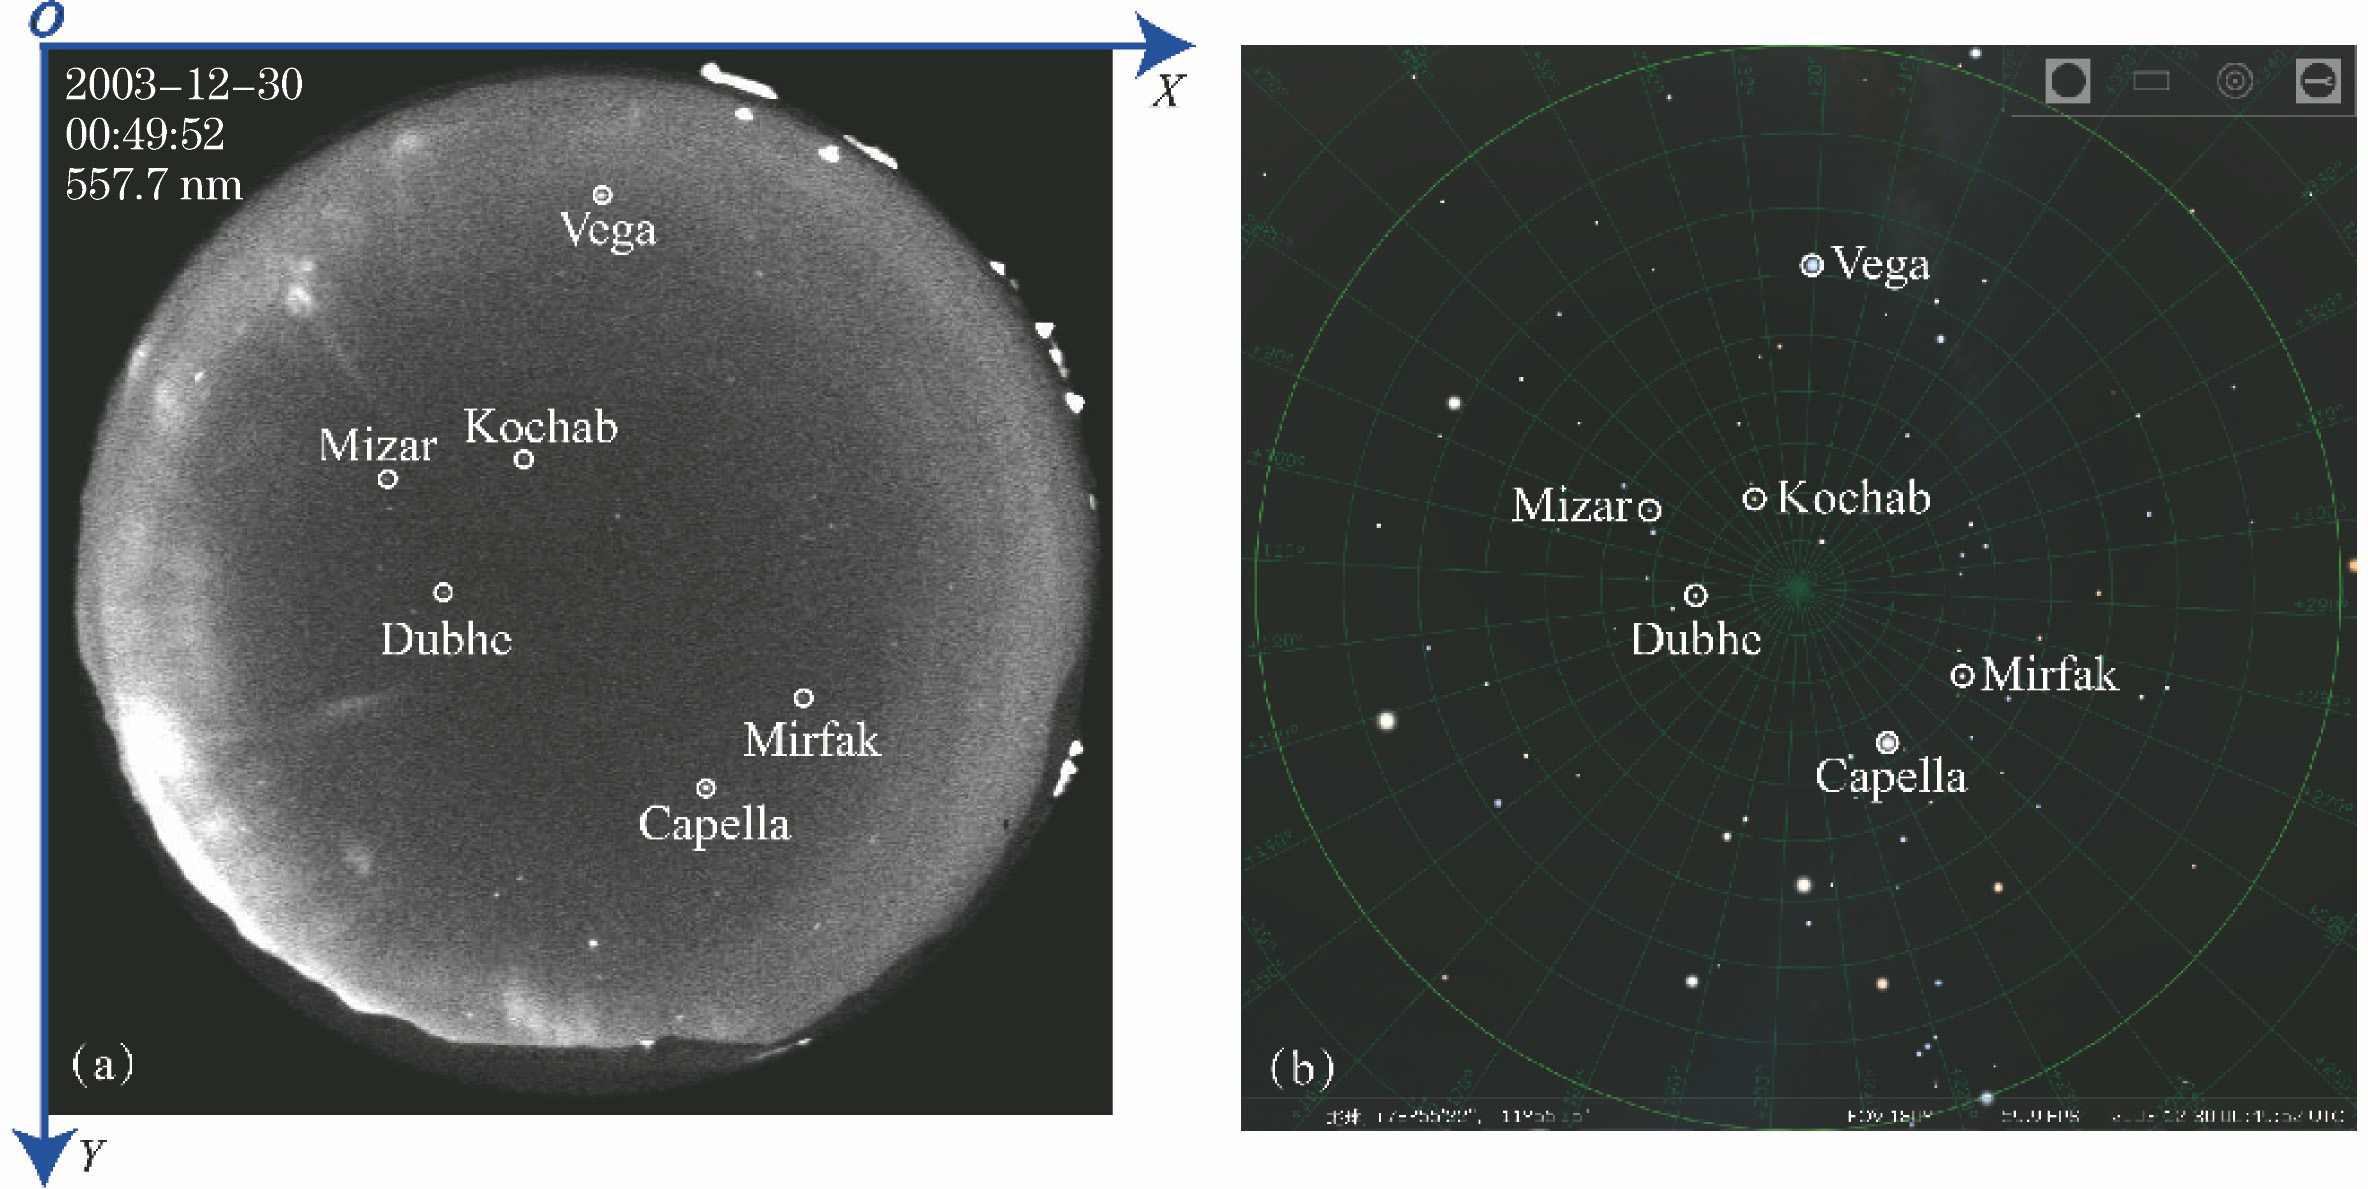
Fig. 1. Distribution of stars. (a) All-sky image of YRS; (b) star map in Stellarium
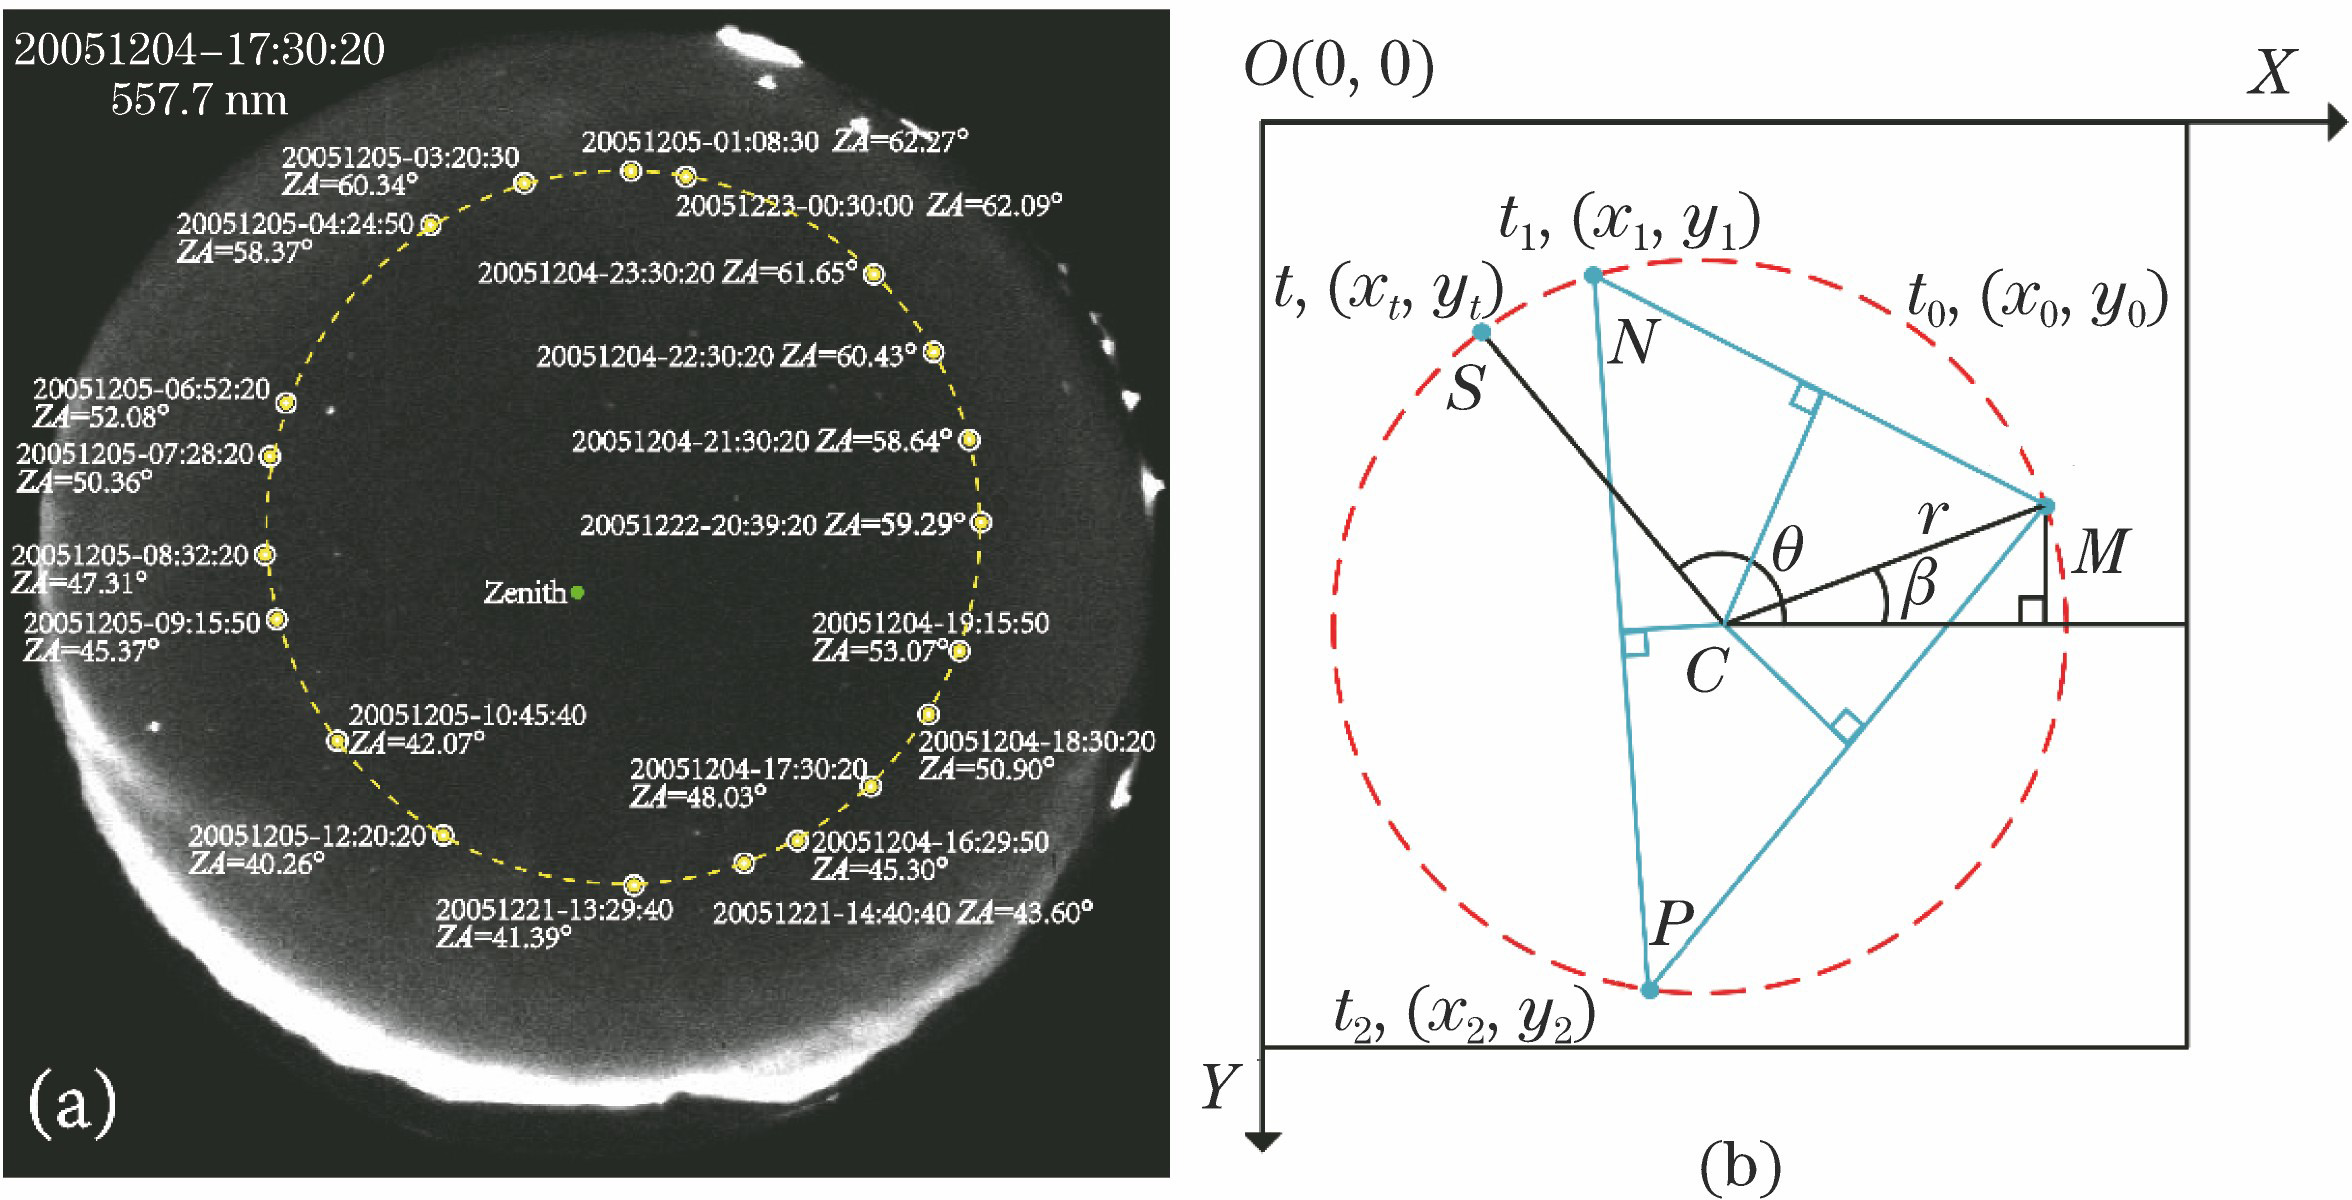
Fig. 2. Visual motion track of stars and diagram of calculating stellar coordinates. (a) 24 h visual motion track of Vega; (b) diagram of calculating stellar coordinate in all-sky image
Fig. 3. Stellar neighborhood
Fig. 4. Scatter plot of six stars data
Fig. 5. An event of DMSP F-16 satellite crossing all-sky field of view from 11:03:33 UT to 11:07:34 UT on December 2, 2005. (a) Trajectory of DMSP satellite projected onto all-sky images; (b) electron spectroscopy; (c) Keogram; (d) energy flux of precipitating electrons; (e) average energy of precipitating electrons; (f) auroral emission intensity
Fig. 6. An event of DMSP F-16 satellite crossing all-sky field of view from 10:49:50 UT to 10:52:20 UT on December 19, 2005. (a) Trajectory of DMSP satellite projected onto all-sky images; (b) electron spectroscopy; (c) Keogram; (d) energy flux of precipitating electrons; (e) average energy of precipitating electrons; (f) auroral emission intensity
| ||||||||||||||||||||||||||||||
Table 1. Diurnal variation of zenith angle of stars in December 22, 2003
| |||||||||||||||||||||||||||
Table 2. Number of star spots detected in 2003 and 2005
| ||||||||||||||||||||||||||||||||||
Table 3. Average radiation intensity of each star in 2003 and average detector output signal value in 2005
| ||||||||||||||||||||||||||||||||||||||||
Table 4. Differences of stellar radiation intensity in 2003 and 2005

Set citation alerts for the article
Please enter your email address
© Copyright 2018-2021 | Chinese Laser Press. All Rights Reserved 沪ICP备15018463号-20